The report now describes notable inflation and substantial labor market improvement, with GDP recovered to its pre-pandemic level. It also notes earlier market-based expectations for a federal funds rate liftoff, reduced debt vulnerabilities, and the end of regular agency CMBS purchases. Projections are much stronger for growth and inflation.
Inflation
The report now describes inflation as having risen notably, with PCE prices up 3.9 percent and core inflation at 3.4 percent, rather than being held down by weak demand and low oil prices. Read the sectionQuotes
Previous report: “weak aggregate demand and low oil prices have held down consumer price inflation”
This report: “PCE (personal consumption expenditures) prices rose 3.9 percent over the 12 months ending in May.” · “The 12-month measure of inflation that excludes food and energy items (so-called core inflation) was 3.4 percent in May, up from 1.4 percent at the end of last year.” · “Consumer price inflation has increased notably this spring as a surge in demand has run up against production bottlenecks and hiring difficulties.”
The report now reports inflation jumped to 3.9 percent in May, well above the 2 percent objective, whereas previously it was 1.3 percent in December and below objective. Read the sectionQuotes
Previous report: “inflation fell from 1.6 percent in December 2019 to a low of 0.5 percent in April, as economic activity dropped sharply. Since then, inflation has partially recovered along with the pickup in demand, but it was only 1.3 percent in December—still well below the Federal Open Market Committee's (FOMC) objective of 2 percent”
This report: “As measured by the 12-month change in the price index for personal consumption expenditures (PCE), inflation jumped from 1.2 percent in December 2020 to 3.9 percent in May, well above the FOMC's longer-run objective of 2 percent.”
The report now says market-based longer-term inflation compensation has climbed to 2010–14 levels, whereas previously it was only slightly above 2019 averages. Read the sectionQuotes
Previous report: “The TIPS-based measure of 5-to-10-year-forward inflation compensation and the analogous measure from inflation swaps are now about 2-1/4 percent and 2-1/2 percent, respectively, a bit above the average levels seen in 2019.”
This report: “Similarly, market measures of longer-term inflation compensation—including inflation swaps and the yield gap between nominal Treasury securities and Treasury Inflation-Protected Securities—continued to climb in 2021, returning to the range observed in the 2010–14 period.” · “In particular, inflation compensation beyond five years has reversed the large declines seen earlier in the pandemic, bouncing back to levels consistent with those observed before 2014, when measures of longer-term inflation compensation ran modestly above 2 percent on a CPI basis, and before these measures showed signs that CPI inflation expectations may have drifted down.”
Labor market
The report now describes substantial labor market improvement in the first half of 2021, with 3.2 million jobs added, replacing the earlier characterization of a slowed recovery. Read the sectionQuotes
Previous report: “The labor market has partially recovered from the pandemic-induced collapse, but the pace of improvement slowed substantially toward the end of last year...” · “The unemployment rate declined only 0.4 percentage point from November through January, while payroll gains averaged just 29,000 per month”
This report: “The labor market improved substantially in the first half of the year as the economy reopened and activity rebounded” · “Payroll employment increased by 3.2 million jobs in the first half of 2021, driven by a 1.6 million job gain in the leisure and hospitality sector” · “Despite the substantial improvement in the labor market, employment remained well below its pre-pandemic level”
Economic activity
The report now says GDP has recovered to its pre-pandemic level, whereas previously it was 2.5 percent below its level four quarters earlier. Read the sectionQuotes
Previous report: “At the end of 2020, GDP was 2.5 percent below its level four quarters earlier.”
This report: “appears to have now recovered to its pre-pandemic level”
Financial conditions
The report now describes longer-term Treasury yields as little changed since mid-February, whereas previously they had increased markedly since mid-2020. Read the sectionQuotes
Previous report: “Yields on nominal Treasury securities at longer maturities increased markedly since mid-2020 after falling sharply in late February and early March”
This report: “Yields on nominal Treasury securities at longer maturities were little changed, on net, since mid-February (figure 30).”
Financial stability
The report now says business and household debt vulnerabilities have declined through the first quarter of 2021, whereas previously business debt had risen and leverage was near historical highs. Read the sectionQuotes
Previous report: “Business debt has risen from levels that were already elevated before the outbreak of the pandemic. Business leverage now stands near historical highs.”
This report: “Vulnerabilities from both business and household debt have declined through the first quarter of 2021, reflecting a slower pace of business borrowing, an improvement in business earnings, and government programs that have supported business and household incomes.”
Monetary policy
The report now says market-based federal funds rate expectations remain below 0.25 percent until the fourth quarter of 2022, about two quarters earlier than in February. Read the sectionQuotes
Previous report: “Market-based measures of federal funds rate expectations over the next few years have increased moderately since June and remain below 0.25 percent until the second quarter of 2023 (figure 29).”
This report: “Market-based measures of the path that the federal funds rate is expected to take over the next few years remain below 0.25 percent until the fourth quarter of 2022, about two quarters earlier than in February (figure 29).”
The report now states that the Federal Reserve ended regular purchases of agency commercial mortgage-backed securities after the March FOMC meeting, citing sustained smooth market functioning. Read the sectionQuotes
This report: “After the March FOMC meeting, in light of the sustained smooth functioning of markets for agency commercial mortgage-backed securities (CMBS), the Federal Reserve ended regular purchases of agency CMBS.”
Projections
The report now projects much stronger 2021 real GDP growth (median 7.0 percent) and higher PCE inflation (median 3.4 percent), with unemployment falling to 4.5 percent. Read the sectionQuotes
The uneven recovery in labor force participation. The labor force participation rate (LFPR) has improved very little since early in the recovery and remains well below pre-pandemic levels. Relative to its February 2020 level, the LFPR remains especially low for individuals without a college education, for individuals aged 55 and older, and for Hispanics and Latinos. Factors likely contributing both to the incomplete recovery of the LFPR and to differences across groups include a surge in retirements, increased caregiving responsibilities, and individuals' fear of contracting COVID-19; expansions to the availability, duration, and level of unemployment insurance benefits may also have supported individuals who withdrew from the labor force. Many of these factors should have a diminishing effect on participation in the coming months as public health conditions continue to improve and as expanded unemployment insurance expires. (See the box "The Uneven Recovery in Labor Force Participation" in Part 1.)
Recent inflation developments. Consumer price inflation has increased notably this spring as a surge in demand has run up against production bottlenecks and hiring difficulties. As these extraordinary circumstances pass, supply and demand should move closer to balance, and inflation is widely expected to move down. (See the box "Recent Inflation Developments" in Part 1.)
Supply chain bottlenecks in U.S. manufacturing and trade. Supply chain bottlenecks have hampered U.S. manufacturers' ability to procure the inputs needed to meet the surge in demand that followed widespread factory shutdowns during the first half of last year. Additionally, a massive influx of goods has exceeded the capacity of U.S. ports, extending manufacturers' wait times for imported parts. The stress on supply chains is reflected in historically high order backlogs and historically low customer inventories; these stresses, together with strong demand, have led to increased price pressures. When these bottlenecks will resolve is uncertain, as they reflect the global supply chain as well as industry-specific factors, but for some goods, such as lumber, the previous sharp increases in prices have begun to reverse. (See the box "Supply Chain Bottlenecks in U.S. Manufacturing and Trade" in Part 1.)
Inflation expectations. To avoid sustained periods of unusually low or high inflation, a fundamental aspect of the FOMC's monetary policy framework is for longer-term inflation expectations to be well anchored at the Committee's 2 percent longer-run inflation objective. Even though the pace of price increases has jumped in the first half of this year, recent readings on various measures of inflation expectations indicate that inflation is expected to return to levels broadly consistent with the FOMC's 2 percent longer-run inflation objective after a period of temporarily higher inflation. That said, upside risks to the inflation outlook in the near term have increased. (See the box "Assessing the Recent Rise in Inflation Expectations" in Part 1.)
Monetary policy rules. Simple monetary policy rules, which relate a policy interest rate to a small number of other economic variables, can provide useful guidance to policymakers. Many of the rules have prescribed strongly negative values of the federal funds rate since the start of the pandemic-driven recession. Because of the effective lower bound for the federal funds rate, the Federal Reserve's other monetary policy tools—namely, forward guidance and asset purchases—have been critical for providing the necessary support to the economy through this challenging period. (See the box "Monetary Policy Rules, the Effective Lower Bound, and the Economic Recovery" in Part 2.)
The Federal Reserve's balance sheet. Since January, the growth in reserves, the drawdown of the Treasury General Account, and the surge in usage of the overnight reverse repurchase agreement (ON RRP) facility have significantly affected the composition of the Federal Reserve's liabilities. Against a backdrop of low short-term market interest rates and ample liquidity, the use of the ON RRP facility has increased substantially since April and has reached a recent high of nearly $1 trillion, compared with usage near zero in February. Factors contributing to this increase included the decline in Treasury bill supply, downward pressure on money market rates, and the recent technical adjustment to the Federal Reserve's administered rates. (See the box "Developments in the Federal Reserve's Balance Sheet and Money Markets" in Part 2.)
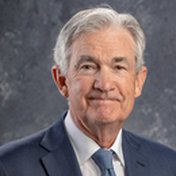 Jerome H. Powell