June 2020 Monetary Policy Report: Full Text
Summary
The COVID-19 outbreak is causing tremendous human and economic hardship across the United States and around the world. The virus and the measures taken to protect public health have induced a sharp decline in economic activity and a surge in job losses, with the unemployment rate, which had been at a 50-year low, soaring to a postwar record high. Weaker demand and significantly lower oil prices are holding down consumer price inflation. The disruptions to economic activity here and abroad significantly affected financial conditions and impaired the flow of credit to U.S. households and businesses. In response to these developments, the Federal Reserve quickly lowered its policy rate to close to zero to support economic activity and took extraordinary measures to stabilize markets and bolster the flow of credit to households, businesses, and communities. Financial conditions have improved, in part reflecting policy measures to support the economy and the flow of credit. The Federal Reserve is committed to using its full range of tools to support the U.S. economy in this challenging time, thereby promoting its maximum-employment and price-stability goals.
Economic and Financial Developments
Economic activity. Economic activity. In response to the public health emergency precipitated by the spread of COVID-19, many protective measures were adopted to limit the transmission of the virus. These social-distancing measures effectively closed parts of the economy, resulting in a sudden and unprecedented fall in economic activity and historic increases in joblessness. Although virus mitigation efforts in many places did not begin until the final two weeks of March, real personal consumption expenditures (PCE) plummeted 6.7 percent in March and an unprecedented 13.2 percent in April. Indicators suggest spending rose in May, but the April data and May indicators taken together point to a collapse in second-quarter real PCE. Likewise, in the housing market, residential sales and construction in April posted outsized declines that are close to some of the largest ever recorded, and heightened uncertainty and weak demand have led many businesses to put investment plans on hold or cancel them outright. These data, along with other information, suggest that real gross domestic product will contract at a rapid pace in the second quarter after tumbling at an annual rate of 5 percent in the first quarter of 2020.
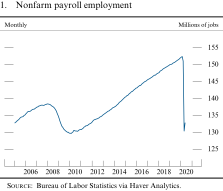
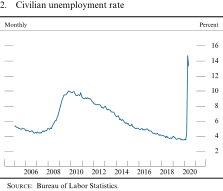
The labor market. The labor market. The severe economic repercussions of the pandemic have been especially visible in the labor market. Since February, employers have shed nearly 20 million jobs from payrolls, reversing almost 10 years of job gains. The unemployment rate jumped from a 50-year low of 3.5 percent in February to a post–World War II high of 14.7 percent in April and then moved down to a still very elevated 13.3 percent in May. The most severe job losses have been sustained by those with lower earnings and by the socioeconomic groups that are disproportionately represented among low-wage jobs.
Inflation. Inflation. Consumer price inflation has slowed abruptly. The 12-month change in the price index for PCE was just 0.5 percent in April. The 12-month measure of PCE inflation that excludes food and energy items (so-called core inflation), which historically has been a better indicator of where overall inflation will be in the future than the total figure, fell from 1.8 percent in February to 1.0 percent in April. This slowing reflected monthly readings for March and April that were especially low because of large price declines in some categories most directly affected by social distancing. Overall inflation also has been held down by substantially lower energy prices, which more than offset the effects of surging prices for food. Despite the sharp slowing in inflation, survey-based measures of longer-run inflation expectations have generally been stable at relatively low levels. However, market-based measures of inflation compensation have moved down to some of the lowest readings ever seen.
Financial conditions. Financial conditions. In late February and over much of March as COVID-19 spread, equity prices plunged and nominal Treasury yields dropped substantially, with yields on longer-term securities reaching all-time record lows. Spreads of yields on corporate bonds over those on comparable-maturity Treasury securities widened significantly as the credit quality of firms declined and market functioning deteriorated; in addition, loans were unavailable for most firms, particularly firms below investment grade. At the most acute phase of this period, trading conditions became extremely illiquid and some critical markets stopped functioning properly. Consumer borrowing also fell as spending slumped. Several markets supporting consumer lending experienced severe strains around this period, including the agency residential mortgage-backed securities (MBS) market as well as the auto, credit card, and student loan securitization markets. In response, the Federal Reserve took unprecedented measures to restore smooth market functioning and to support the flow of credit in the economy, including the creation of a number of emergency credit and liquidity facilities.1 These actions, along with the aggressive response of fiscal policy, stabilized financial markets and led to a notable improvement in financial conditions for both firms and households as well as state and local governments. Even so, lending standards for both households and businesses have become less accommodative, and borrowing conditions are tight for low-rated households and businesses.
Financial stability. Financial stability. The COVID-19 pandemic has abruptly halted large swaths of economic activity and led to swift financial repercussions. Despite increased resilience from the financial and regulatory reforms adopted since 2008, financial system vulnerabilities—most notably those associated with liquidity and maturity transformation in the nonbank financial sector—have amplified some of the economic effects of the pandemic. Accordingly, financial-sector vulnerabilities are expected to be significant in the near term. The strains on household and business balance sheets from the economic and financial shocks since March will likely create persistent fragilities. Financial institutions may experience strains as a result. The Federal Reserve, with approval of the Secretary of the Treasury, established new credit and liquidity facilities under section 13(3) of the Federal Reserve Act to alleviate severe dislocations that arose in a number of financial markets and to support the flow of credit to households, businesses, and state and local governments. Furthermore, as financial stresses abroad risked spilling over into U.S. credit markets, the Federal Reserve and several other central banks announced the expansion and enhancement of dollar liquidity swap lines. In addition, the Federal Reserve introduced a new temporary repurchase agreement facility for foreign monetary authorities. The Federal Reserve has also made a number of adjustments to its regulatory and supervisory regime to facilitate market functioning and reduce regulatory impediments to banks supporting households, businesses, and municipal customers affected by COVID-19. (See the box "Developments Related to Financial Stability" in Part 1.)
International developments. International developments. The spread of COVID-19 throughout the world and the measures taken to contain it have produced devastating effects on the global economy. Amid widespread and stringent shutdowns, recent data suggest that global economic activity in the first half of the year has experienced a sharp and synchronized contraction greater than that in the Global Financial Crisis. The many mandated closures of nonessential businesses abroad and the collapse in consumer demand contributed to a significant deterioration in labor markets and subdued inflation. Unlike past recessions, services activity in the foreign economies has dropped more sharply than manufacturing, with restrictions on movement having severely curtailed spending on travel, tourism, restaurants, and recreation. Against this backdrop, foreign governments and central banks have responded strongly and swiftly to support incomes and to improve market liquidity and the provision of credit. More recently, economic activity has begun to revive in some foreign economies as authorities eased social-distancing restraints.
The rapid spread of COVID-19 weighed heavily on global risk sentiment, with financial stresses intensifying and liquidity conditions deteriorating in many foreign financial markets. Aggressive fiscal and monetary policy responses in the United States and abroad, however, helped boost sentiment and improve market functioning. On balance, financial conditions abroad remain tighter than at the beginning of the year, especially in some emerging market economies. Since February, global equity prices moved lower, sovereign interest rates in the European periphery increased somewhat, and measures of sovereign spreads in emerging market economies widened significantly. In many advanced economies, long-term interest rates reached historically low levels.
Monetary Policy
Easing monetary policy. Easing monetary policy. In light of the effects of COVID-19 on economic activity and on risks to the outlook, the FOMC rapidly lowered the target range for the federal funds rate. Specifically, at two meetings in March, the FOMC lowered the target range for the federal funds rate by a total of 1-1/2 percentage points, bringing it to the current range of 0 to 1/4 percent. The Committee expects to maintain this target range until it is confident that the economy has weathered recent events and is on track to achieve its maximum-employment and price-stability goals. The Committee noted that it would continue to monitor the implications of incoming information for the economic outlook, including information related to public health, as well as global developments and muted inflation pressures, and that it would use its tools and act as appropriate to support the economy.
Safeguarding market functioning. Safeguarding market functioning. Market functioning deteriorated in many markets in late February and much of March, including the critical Treasury and agency MBS markets. The Federal Reserve swiftly took a series of policy actions to address these developments. The FOMC announced it would purchase Treasury securities and agency MBS in the amounts needed to ensure smooth market functioning and the effective transmission of monetary policy to broader financial conditions. The Open Market Desk began offering large-scale overnight and term repurchase agreement operations. The Federal Reserve coordinated with other central banks to enhance the provision of liquidity via the standing U.S. dollar liquidity swap line arrangements and announced the establishment of temporary U.S. dollar liquidity arrangements (swap lines) with additional central banks. The Federal Reserve also established a temporary repurchase agreement facility for foreign and international monetary authorities. (Separately, the Board introduced several facilities with the backing of the U.S. Treasury to more directly support the flow of credit to the economy.) Since these policy actions were announced, the functioning of Treasury and MBS markets has gradually improved. (See the box "Federal Reserve Actions to Ensure Smooth Functioning of Treasury and MBS Markets" in Part 2.) Reflecting these policy responses, the size of the Federal Reserve's balance sheet increased significantly. (See the box "Developments on the Federal Reserve's Balance Sheet" in Part 2.)
Fed Listens. Fed Listens. The Federal Reserve has released a report on its Fed Listens initiative. This initiative is part of a broad review of the monetary policy strategy, tools, and communication practices the Federal Reserve uses to pursue its statutory dual-mandate goals of maximum employment and price stability. A key component of the review was a series of public Fed Listens events aimed at consulting with a broad range of stakeholders in the U.S. economy on issues pertaining to the dual-mandate objectives.
Special Topics
Disparities in job loss during the pandemic. Disparities in job loss during the pandemic. The deterioration in labor market conditions since February has been sudden, severe, and widespread. At the same time, workers in some industries, occupations, demographic groups, and locations have experienced more significant employment declines than others. Although disparities in labor market outcomes often arise during recessions, factors unique to this episode have also contributed to the recent divergence. Job losses have been especially severe for those with lower earnings and for the socioeconomic groups that are disproportionately represented among low-wage jobs. (See the box "Disparities in Job Loss during the Pandemic" in Part 1.)
Small businesses during the COVID-19 crisis. Small businesses during the COVID-19 crisis. Small businesses make up nearly half of U.S. private-sector employment and play key roles in local communities. The pandemic poses acute risks to the survival of many small businesses. Their widespread failure would adversely alter the economic landscape of local communities and potentially slow the economic recovery and future labor productivity growth. The Congress, the Federal Reserve, and other federal agencies are making aggressive efforts to support small businesses. (See the box "Small Businesses during the COVID-19 Crisis" in Part 1.)
Federal fiscal policy response to COVID-19. Federal fiscal policy response to COVID-19. While the economic consequences resulting from the pandemic have been historically large, the amount of fiscal support that has been enacted constitutes the fastest and largest fiscal response to any postwar economic downturn. The pieces of legislation enacted since the arrival of the pandemic that have composed this response are expected to raise government outlays and reduce tax revenues by nearly $2 trillion in the current fiscal year. (See the box "Federal Fiscal Policy Response to COVID-19" in Part 1.)
Policy response to COVID-19 in foreign economies. Policy response to COVID-19 in foreign economies. Authorities in many foreign economies have implemented fiscal, monetary, and regulatory measures to mitigate disruptions caused by the COVID-19 pandemic. Sizable fiscal packages targeted the sudden loss of income by firms and households. Actions by central banks, including purchases of sovereign and private bonds, have aimed to restore market functioning, sustain the provision of credit to businesses and households during the pandemic, and support the economic recovery. Regulatory changes have focused on ensuring that banks sustain their capacity to absorb pandemic-related losses while continuing to lend to households and firms. (See the box "Policy Response to COVID-19 in Foreign Economies" in Part 1.)
Footnotes
Statement on Longer-Run Goals and Monetary Policy Strategy
Adopted effective January 24, 2012; as amended effective January 29, 2019
The Federal Open Market Committee (FOMC) is firmly committed to fulfilling its statutory mandate from the Congress of promoting maximum employment, stable prices, and moderate long-term interest rates. The Committee seeks to explain its monetary policy decisions to the public as clearly as possible. Such clarity facilitates well-informed decisionmaking by households and businesses, reduces economic and financial uncertainty, increases the effectiveness of monetary policy, and enhances transparency and accountability, which are essential in a democratic society.
Inflation, employment, and long-term interest rates fluctuate over time in response to economic and financial disturbances. Moreover, monetary policy actions tend to influence economic activity and prices with a lag. Therefore, the Committee's policy decisions reflect its longer-run goals, its medium-term outlook, and its assessments of the balance of risks, including risks to the financial system that could impede the attainment of the Committee's goals.
The inflation rate over the longer run is primarily determined by monetary policy, and hence the Committee has the ability to specify a longer-run goal for inflation. The Committee reaffirms its judgment that inflation at the rate of 2 percent, as measured by the annual change in the price index for personal consumption expenditures, is most consistent over the longer run with the Federal Reserve's statutory mandate. The Committee would be concerned if inflation were running persistently above or below this objective. Communicating this symmetric inflation goal clearly to the public helps keep longer-term inflation expectations firmly anchored, thereby fostering price stability and moderate long-term interest rates and enhancing the Committee's ability to promote maximum employment in the face of significant economic disturbances. The maximum level of employment is largely determined by nonmonetary factors that affect the structure and dynamics of the labor market. These factors may change over time and may not be directly measurable. Consequently, it would not be appropriate to specify a fixed goal for employment; rather, the Committee's policy decisions must be informed by assessments of the maximum level of employment, recognizing that such assessments are necessarily uncertain and subject to revision. The Committee considers a wide range of indicators in making these assessments. Information about Committee participants' estimates of the longer-run normal rates of output growth and unemployment is published four times per year in the FOMC's Summary of Economic Projections. For example, in the most recent projections, the median of FOMC participants' estimates of the longer-run normal rate of unemployment was 4.4 percent.
In setting monetary policy, the Committee seeks to mitigate deviations of inflation from its longer-run goal and deviations of employment from the Committee's assessments of its maximum level. These objectives are generally complementary. However, under circumstances in which the Committee judges that the objectives are not complementary, it follows a balanced approach in promoting them, taking into account the magnitude of the deviations and the potentially different time horizons over which employment and inflation are projected to return to levels judged consistent with its mandate.
The Committee intends to reaffirm these principles and to make adjustments as appropriate at its annual organizational meeting each January.
Domestic Developments
The COVID-19 outbreak has led to an acute weakening in the labor market since February
In response to the public health crisis caused by the spread of COVID-19, households, businesses, and governments took dramatic measures to slow the spread of the virus. As a result, many sectors of the economy were effectively closed from mid-March through April but have seen some gradual lifting of restrictions since then. The severity, scope, and speed of the ensuing downturn in economic activity have been significantly worse than any recession since World War II. After posting strong gains in both January and February, payroll employment plummeted by an unprecedented 22 million in March and April before adding back 2.5 million jobs in May (figure 1). The unemployment rate jumped to 14.7 percent in April, the highest level since the Great Depression. In May, the unemployment rate fell to 13.3 percent, which was almost 10 percentage points above the February level (figure 2). Although unemployment soared for all major racial and ethnic groups, the unemployment rate for Hispanics posted the largest increase over this period (figure 3). (For more discussion of the pandemic's effects on the labor market, see the box "Disparities in Job Loss during the Pandemic.")
Nonfarm payroll employment
Source: Bureau of Labor Statistics via Haver Analytics.
Unemployment rate, by race and ethnicity
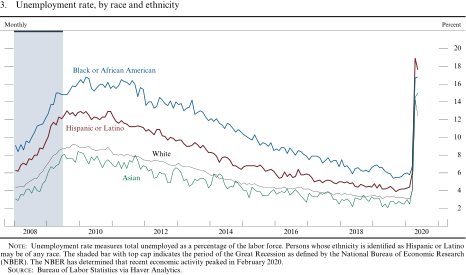
Unemployment rate measures total unemployed as a percentage of the labor force. Persons whose ethnicity is identified as Hispanic or Latino may be of any race. The shaded bars with top caps indicate periods of business recession as defined by the National Bureau of Economic Research: December 2007–June 2009. The NBER has determined that recent economic activity peaked in February 2020.
Source: Bureau of Labor Statistics via Haver Analytics.
Data received since the survey week for payroll employment in May suggest that job gains have continued.2 Although initial claims for unemployment insurance have remained high, it is unclear whether these new claims reflect additional large numbers of layoffs or that states are clearing their backlogs of applications. In addition, weekly employment data from the payroll processor ADP indicate that rehiring has continued and that payroll employment will likely move up again in June, albeit from what remains a very low level.
The labor force participation rate (LFPR)—the share of the population that is either working or actively looking for work—fell from around 63-1/2 percent early this year to 60.8 percent in May (figure 4). The May LFPR reading was one of the lowest since the early 1970s.3 Poor employment prospects or concerns about safety in the workplace might have caused some of the newly unemployed to exit the labor force or induced others to refrain from entering.4 However, with so much of the labor market shut in and most new hiring at a standstill, the distinction between being unemployed and out of the labor force likely has become especially blurred. The employment-to-population ratio for individuals 16 and over—the share of that segment of the population who are working—combines movements in both unemployment and labor force participation. This measure was 51.3 percent in April and 52.8 percent in May, the lowest readings in the history of this series, which began in 1948.
Labor force participation rates and employment-to-population ratio
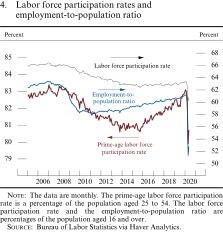
The data are monthly. The prime-age labor force participation rate is a percentage of the population aged 25 to 54. The labor force participation rate and the employment-to-population ratio are percentages of the population aged 16 and over.
Source: Bureau of Labor Statistics via Haver Analytics.
Disparities in Job Loss during the Pandemic
For nearly all industries, occupations, demographic groups, and locations, employment was substantially lower in May than in February. While job loss has been pervasive, some groups have experienced more severe employment declines than others, particularly workers with lower earnings and the socioeconomic groups that are disproportionately represented among low-wage jobs; employment declines have also been larger in some states than in others. Although disparities in labor market outcomes across groups often widen during recessions, certain factors unique to this episode—in particular, the social-distancing measures taken by households, businesses, and governments to limit in-person interactions—have contributed to the recent divergence.
Because jobs differ in the degree to which they involve personal contact and physical proximity, in whether they provide an "essential function," and in whether their business operations can be conducted remotely, social-distancing measures have had disparate consequences across industries and, in turn, on particular types of workers who tend to work in heavily affected industries. For example, the net proportion of jobs lost since February has been greater in industries such as accommodation and food services (where social-distancing regulations have severely affected many businesses and where workers are frequently unable to work from home) and smaller in industries such as professional and business services and financial activities (where workers may be less affected by social distancing and are generally more able to conduct work from home).1 In keeping with this pattern, states that rely heavily on tourism—such as Hawaii and Nevada—saw exceptionally large increases in unemployment through April (the most recent month for which state unemployment rate data are available).
Net job loss since February thus far has been concentrated in lower-wage industries, suggesting that employment declines have been disproportionately large among lower-paid workers who may be less able to financially weather an extended period of unemployment. Indeed, estimates of employment declines based on a worker's previous wage (using data from the payroll provider ADP), shown in figure A, also indicate this disproportionate pattern of job loss. From February to mid-April, employment fell substantially more for workers who were previously earning wages in the bottom fourth of wage earners, compared with other workers. Despite somewhat more rapid job growth for lower-wage earners in subsequent weeks, employment for lower-wage earners remains roughly 35 percent lower than in February, compared with 5 to 15 percent lower employment for higher-wage earners. These differences are also consistent with results from a recent survey conducted by the Federal Reserve Board that indicated that among households with an annual income of $40,000 or less, nearly 40 percent of individuals who were employed in February experienced job loss in March or early April, compared with 20 percent of the population overall.2
Employment declines for low-, middle-, and high-wage workers
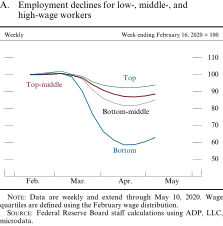
Data are weekly and extend through May 10, 2020. Wage quartiles are defined using the February wage distribution.
Source: Federal Reserve Board staff calculations using ADP, LLC, microdata.
Figure B illustrates that the decline in employment (as a fraction of the population) has also been especially large for people aged 16 to 24 compared with older workers, for people without a bachelor's degree compared with those with at least a bachelor's degree, and for Hispanics compared with other races and ethnicities. In addition, employment rates have dropped somewhat more for women than for men, and for Asians and African Americans compared with whites. In general, the groups with the larger employment declines are most commonly employed in the industries that have experienced the greatest net employment declines thus far, such as accommodation, food service, and retail trade; these demographic groups are also less likely to report being able to work from home.
Decline in employment-to-population ratio, by demographic group
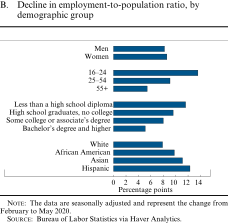
The data are seasonally adjusted and represent the change from February to May 2020.
Source: Bureau of Labor Statistics via Haver Analytics.
In the months ahead, labor market prospects for the unemployed and underemployed—both overall and for particularly hard-hit groups of workers—will largely depend on the course of the COVID-19 outbreak itself and on actions taken to halt its spread. Recent job losses differ from those of previous recessions not only in the suddenness and severity with which they occurred, but also in the unusually high share of workers who expect them to be temporary.3 Research has shown that workers who return to their previous employers after a temporary layoff tend to earn wages similar to what they were making previously, whereas laid-off workers who do not return to their previous employer experience a longer-lasting decline in earnings.4 If public health conditions improve quickly so that social-distancing measures can be further relaxed and consumers become more willing to engage in a wider range of commercial activities, workers' expectations of being recalled may prove true, and many recent job losses may turn out to be temporary layoffs from which workers can quickly recover. However, if economic activity remains weak for a prolonged period, businesses that had intended to reopen at full capacity may instead be compelled to shutter completely or to resume operations at a diminished scale, turning many temporary layoffs into permanent job losses. Perhaps reflecting this possibility , the number of unemployed workers reporting that they had permanently separated from their previous employer rose by roughly 300,000 between April and May, even as the total number of unemployed persons began to decline. As lower-paid workers are disproportionately employed by small businesses—which typically have fewer financial resources than larger firms—they may be at heightened risk of seeing their former employers shut down and hence experiencing the scarring effects of permanent separations.5
Wages are likely being held down, although compositional shifts have temporarily boosted some wage measures
While reliable data are limited, anecdotal evidence suggests that the economic downturn is putting downward pressure on wages. The series on wage growth computed by the Federal Reserve Bank of Atlanta, which tracks the median 12-month wage growth of individuals reporting to the Current Population Survey, has changed little in recent months (figure 5).5 In contrast, measures that look at average wage costs have jumped because of compositional effects, as COVID-19 mitigation efforts and weaker demand have disproportionately affected lower-wage workers and left relatively more higher-wage workers on payrolls. Indeed, average hourly earnings from the payroll survey jumped 6.7 percent over the 12 months ending in May, largely reflecting this change in the composition of private payrolls. In the first quarter, both the employment cost index (ECI) and compensation per hour, which include both wages and benefits, posted moderate gains, with neither series reflecting much of the pandemic's repercussions.6
Measures of change in hourly compensation
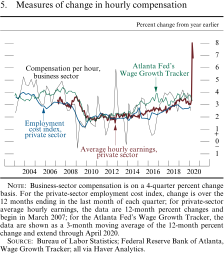
Business-sector compensation is on a 4-quarter percent change basis. For the private-sector employment cost index, change is over the 12 months ending in the last month of each quarter; for private-sector average hourly earnings, the data are 12-month percent changes and begin in March 2007; for the Atlanta Fed's Wage Growth Tracker, the data are shown as a 3-month moving average of the 12-month percent change and extend through April 2020.
Source: Bureau of Labor Statistics; Federal Reserve Bank of Atlanta, Wage Growth Tracker; all via Haver Analytics.
Price inflation has moved significantly lower
As measured by the 12-month change in the price index for personal consumption expenditures (PCE), inflation was just 0.5 percent in April, compared with 1.6 percent over the same period a year ago (figure 6). The abrupt slowing in total PCE price inflation this year partly reflects sharp declines in consumer energy prices that resulted from the collapse in oil prices. In contrast, food prices have moved higher despite declines in food commodity prices, likely reflecting higher demand at retail grocery stores in combination with pandemic-related supply chain issues. In addition to the drop in energy prices, the unprecedented reductions in demand for some services as a result of social distancing have led to sharp drops in prices for airfares and lodging away from home. These price declines led the 12-month measure of core PCE inflation—that is, inflation excluding volatile consumer food and energy prices—to move significantly lower, falling from 1.8 percent in February to just 1.0 percent in April, as the monthly readings for March and April were exceptionally low. An appreciation of the dollar has also contributed to the slowing in core inflation.
Change in the price index for personal consumption expenditures
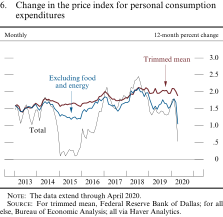
The data extend through April 2020.
Source: For trimmed mean, Federal Reserve Bank of Dallas; for all else, Bureau of Economic Analysis; all via Haver Analytics.
The trimmed mean measure of PCE price inflation constructed by the Federal Reserve Bank of Dallas provides an alternative way to purge measured inflation of transitory influences, and it is less sensitive than the core measure to extreme price movements such as the recent outsized swings in airfares and lodging.7 The 12-month change in this measure edged down to 1.9 percent in April from 2.1 percent in February.
Oil prices are notably lower this spring
Against the backdrop of a global collapse in the demand for oil and a rapid increase in oil inventories, the Brent price of crude oil plunged from about $65 per barrel in early January to around $20 per barrel at the end of April (figure 7).8 More recently, prices have rebounded to about $40 per barrel, as an agreement between OPEC (Organization of the Petroleum Exporting Countries) and Russia to cut oil production by nearly 10 percent of global output appears to have taken effect. Additionally, the dramatic downturn in global oil demand appears to be abating as countries begin to ease their COVID-19 lockdown policies. The decline in oil prices has contributed to similar movements in retail gasoline prices, which have also fallen in recent months.
Spot and futures prices for crude oil
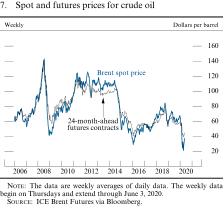
The data are weekly averages of daily data. The weekly data begin on Thursdays and extend through June 3, 2020.
Source: ICE Brent Futures via Bloomberg.
Series: Brent spot price and 24-month-ahead futures contracts Horizon: January 1, 2006, to June 3, 2020 Description: A line chart with two curves over January 1, 2006, to June 3, 2020. Units are dollars per barrel, and data are weekly. The Brent spot price curve starts at about 60, peaks at about 140 by mid-2008, drops to about 40 by the end of 2008, and increases to approximately 130 by early 2011. It fluctuates between about 90 and 130 through 2014, decreases sharply to about 30 by early 2016, increases to about 85 by late 2018, and fluctuates between about 50 and 75 through 2019 before decreasing to 20 in early 2020 and ending at about 35. The 24-month-ahead futures curve tracks the Brent spot curve closely except for in mid-2008 to late 2010 and in late 2014 to late 2016, where it tracks about 5 to 10 points above, and in mid-2011 to mid-2014 and in 2018, where it remains about 5 to 10 points below. The curve ends a little above 40 in mid-2020.
Reported prices of imports other than energy fell
After rising early this year, nonfuel import prices fell in April, as the dollar appreciated and the sharp decline in global demand put downward pressure on non-oil commodity prices—a substantial component of nonfuel import prices (figure 8). Prices of industrial metals fell sharply in the first months of the year but edged up in May, as economic activity in some economies began to revive.
Nonfuel import prices and industrial metals indexes
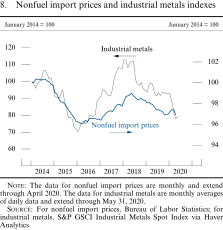
The data for nonfuel import prices are monthly and extend through April 2020. The data for industrial metals are monthly averages of daily data and extend through May 31, 2020.
Source: For nonfuel import prices, Bureau of Labor Statistics; for industrial metals, S&P GSCI Industrial Metals Spot Index via Haver Analytics.
However, survey-based measures of long-run inflation expectations have been broadly stable...
Despite the tumultuous situation of recent months, survey-based measures of inflation expectations at medium- and longer-term horizons, which likely influence actual inflation by affecting wage- and price-setting decisions, so far have changed little (figure 9). In the University of Michigan Surveys of Consumers, the median value for inflation expectations over the next 5 to 10 years was 2.7 percent in May and has fluctuated around 2-1/2 percent since the end of 2016. In the Survey of Consumer Expectations, conducted by the Federal Reserve Bank of New York, the median of respondents' expected inflation rate three years ahead moved lower, on net, in the second half of last year and has averaged 2.5 percent since. In the Survey of Professional Forecasters, conducted by the Federal Reserve Bank of Philadelphia, the median expectation for the annual rate of increase in the PCE price index over the next 10 years edged down to 1.9 percent in the second-quarter survey, below the 2 percent level that had been reported for some time.
Surveys of inflation expectations
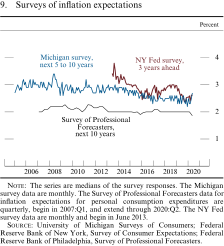
The series are medians of the survey responses. The Michigan survey data are monthly. The Survey of Professional Forecasters data for inflation expectations for personal consumption expenditures are quarterly, begin in 2007:Q1, and extend through 2020:Q2. The NY Fed survey data are monthly and begin in June 2013.
Source: University of Michigan Surveys of Consumers; Federal Reserve Bank of New York, Survey of Consumer Expectations; Federal Reserve Bank of Philadelphia, Survey of Professional Forecasters.
. . . but market-based measures of inflation compensation are notably lower
Market-based measures of inflation compensation can also be used to make inferences about inflation expectations. However, the inference is not straightforward because market-based measures can be importantly affected by changes in premiums that provide compensation for bearing inflation and liquidity risks. Measures of longer-term inflation compensation—derived either from differences between yields on nominal Treasury securities and those on comparable-maturity Treasury Inflation-Protected Securities (TIPS) or from inflation swaps—have decreased, on net, since the end of 2019 (figure 10). The 5-year and 5-to-10-year-forward measures of inflation compensation are about 60 basis points and 40 basis points lower, respectively, than at the beginning of the year.9 Both measures dropped sharply in March, with the 5-year measure reaching the lowest level since the Global Financial Crisis and the 5-to-10-year measure hitting new historical lows. These declines partly reflected a reduction in the relative liquidity of TIPS compared with nominal Treasury securities. As liquidity improved, inflation compensation partially retraced. The TIPS-based measure of 5-to-10-year-forward inflation compensation and the analogous measure from inflation swaps are now about 1-1/2 percent and 1-3/4 percent, respectively.10
5-to-10-year-forward inflation compensation
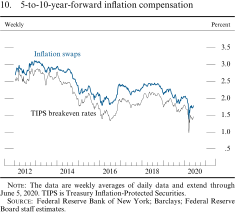
The data are weekly averages of daily data and extend through June 5, 2020. TIPS is Treasury Inflation-Protected Securities.
Source: Federal Reserve Bank of New York; Barclays; Federal Reserve Board staff estimates.
Series: Inflation swaps and TIPS breakeven rates Horizon: January 13, 2012, to June 5, 2020 Description: A line chart with two curves over January 13, 2012, to June 5, 2020. Units are percent, and the data are weekly. The inflation swaps curve starts at about 2.7, increases to about 3.1 by early 2013, decreases to about 1.75 by mid-2016, wavers between 1.75 and 2.5 until the end of 2019, drops sharply to 1.4 in early 2020, and then rebounds to about 1.8 by mid-2020. The TIPS breakeven rates curve falls about 0.25 to 0.5 points below the inflation swaps curve but maintains the same general trend over the period.
Real gross domestic product has contracted severely and with unprecedented speed
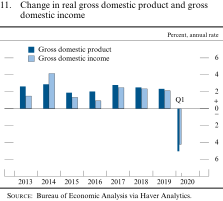
After posting a moderate gain in 2019, real gross domestic product (GDP) fell at an annual rate of 5 percent in the first quarter, with that decline likely all occurring in the final weeks of the quarter (figure 11). In the second quarter, real GDP appears to be plummeting at a breathtaking pace. Indeed, many professional forecasters are projecting second-quarter real GDP to fall at an annual rate of 30 to 40 percent. This severe contraction reflects a steep drop in consumer spending associated with measures to contain the spreading virus. Uncertainty about the economic outlook also likely has pushed down business fixed investment, and events abroad have led to a steep drop in exports. In the manufacturing sector, output fell sharply in March and posted its largest decline on record in April as many factories closed temporarily for all or most of both months. This decrease in factory output included nearly all motor vehicle and civilian aircraft manufacturers. However, amid some easing of restrictions, there are signs that manufacturing activity moved up in May, partly as a result of the ramp-up in automotive production.
Change in real gross domestic product and gross domestic income
Source: Bureau of Economic Analysis via Haver Analytics.
Social distancing has led to a dramatic plunge in household spending and earnings
After having increased at a solid 2.7 percent pace in 2019, real PCE fell at an annual rate of 6.8 percent in the first quarter of 2020, one of the largest quarterly drops in the history of this series (figure 12).11 As concerns about the virus outbreak grew and government restrictions mounted, real PCE collapsed, falling 6.7 percent in March and a record 13.2 percent in April. Although indicators point to an increase in May—which is consistent with some relaxation of government restrictions—taken together, the April data and May indicators point to an unprecedented decline in second-quarter consumer outlays. Real disposable personal income (DPI), a measure of households' after-tax purchasing power, fell in the first quarter, mostly because of a drop in household income from wages and salaries. However, in April, real DPI jumped 13-1/2 percent, pushing its April level up relative to the fourth quarter at an annual rate of more than 30 percent. Although aggregate earnings from employment collapsed in April, this income loss was more than offset by government income support from unemployment insurance and stimulus payments.12 With households unwilling or unable to spend a commensurate amount of their available aggregate income, the April saving rate shot up to 33 percent (figure 13).
Change in real personal consumption expenditures and disposable personal income
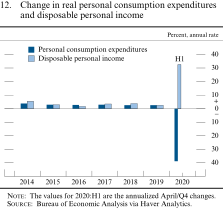
The values for 2020:H1 are the annualized April/Q4 changes.
Source: Bureau of Economic Analysis via Haver Analytics.
Personal saving rate
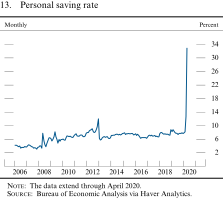
The data extend through April 2020.
Source: Bureau of Economic Analysis via Haver Analytics.
Consumer sentiment has tumbled...
Households' concerns about their economic situation, as reflected in consumer sentiment, may be leading them to save more for precautionary reasons. The University of Michigan Surveys of Consumers index of consumer sentiment dropped almost 29 points between February and May (figure 14), with declines in both the current and expected conditions indexes. The Conference Board survey measure in May also was down sharply from February, with respondents similarly grim about current prospects but somewhat more upbeat than in the Michigan survey about future conditions.
Indexes of consumer sentiment
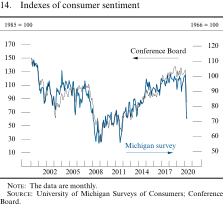
The data are monthly.
Source: University of Michigan Surveys of Consumers; Conference Board.
. . . and overall household wealth fell in the first quarter
In the first quarter, the ratio of aggregate household net worth to household income fell, driven by sharp declines in equity prices (figure 15). House prices—which tend to respond to economic developments more slowly than equity prices and are of particular importance for the value of assets held by a large portion of households—continued to increase in the first quarter and moved up further in April (figure 16). Since March, equity prices have posted sizable gains but are still below their February peak.
Wealth-to-income ratio
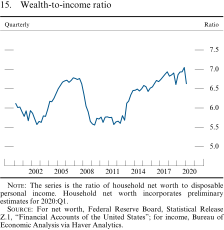
The series is the ratio of household net worth to disposable personal income. Household net worth incorporates preliminary estimates for 2020:Q1.
Source: For net worth, Federal Reserve Board, Statistical Release Z.1, "Financial Accounts of the United States"; for income, Bureau of Economic Analysis via Haver Analytics.
Prices of existing single-family houses
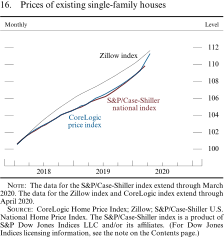
The data for the S&P/Case-Shiller index extend through March 2020. The data for the Zillow index and CoreLogic index extend through April 2020.
Source: CoreLogic Home Price Index; Zillow; S&P/Case-Shiller U.S. National Home Price Index. The S&P/Case-Shiller index is a product of S&P Dow Jones Indices LLC and/or its affiliates. (For Dow Jones Indices licensing information, see the note on the Contents page.)
Consumer lending standards have become less accommodative, but credit is still available to households with strong credit profiles
Since the onset of the pandemic, consumer lending standards have become less accommodative on balance. Borrowing conditions are tight for individuals with low credit ratings, but credit remains available to those with strong credit profiles. Nevertheless, consumer borrowing has fallen as spending has slumped (figure 17). While banks have tightened lending standards on credit card and auto loans, according to the April Senior Loan Officer Opinion Survey on Bank Lending Practices (SLOOS), captive auto lenders have rolled out generous loan incentives to boost sales.13 Due to the high cost of servicing loans in forbearance and uncertainty about whether borrowers will be able to resume making payments when the forbearance period ends, mortgages have become hard to obtain for borrowers with low credit scores or with incomes that are difficult to document. Credit conditions have also tightened significantly for other higher-risk loans, such as jumbo loans and cash-out refinances, and the increase in costs and risks associated with originating mortgages has raised primary mortgage rates relative to yields on mortgage-backed securities (MBS). Nevertheless, mortgage rates currently have fluctuated around the lowest levels seen in the past 10 years (figure 18).
Consumer credit flows
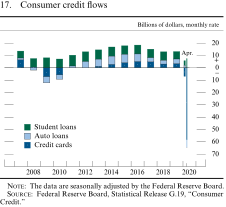
The data are seasonally adjusted by the Federal Reserve Board.
Source: Federal Reserve Board, Statistical Release G.19, "Consumer Credit."
Mortgage rates
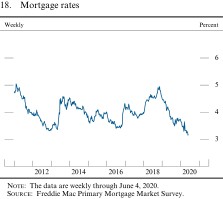
The data are weekly through June 4, 2020.
Source: Freddie Mac Primary Mortgage Market Survey.
Housing-sector activity has fallen sharply after starting the year on a solid footing...
After turning up starting around the middle of 2019 as mortgage rates moved lower, new home sales, existing home sales, and single-family starts and permits have posted outsized declines beginning in March that are all close to the largest ever recorded (figures 19 and 20). Similarly, the COVID-19 outbreak and mitigation efforts have caused households' perceptions of homebuying conditions and builders' ratings of current sales to move down despite historically low mortgage rates.
New and existing home sales
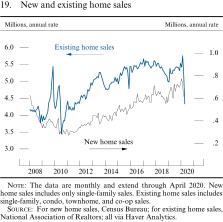
The data are monthly and extend through April 2020. New home sales includes only single-family sales. Existing home sales includes single-family, condo, townhome, and co-op sales.
Source: For new home sales, Census Bureau; for existing home sales, National Association of Realtors; all via Haver Analytics.
Private housing starts and permits
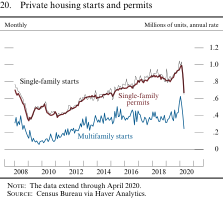
The data extend through April 2020.
Source: Census Bureau via Haver Analytics.
. . . and business fixed investment has tumbled...
The pandemic has curtailed business investment, as many investment projects were delayed or canceled because of lower profit expectations, concerns about future demand, reduced credit availability, and uncertainty about how businesses will operate in the future. Real business fixed investment—that is, private expenditures for equipment, structures, research and development (R&D), and other intellectual property—contracted at an annual rate of about 8.0 percent in the first quarter of 2020, coming off a drop of 0.4 percent for 2019 as a whole (figure 21). The decline was centered in equipment investment as well as in outlays for nonresidential buildings. In addition, lower oil prices contributed to a drop in investment in drilling and mining structures. Investment in intellectual property like software, R&D, and entertainment originals recorded a tepid increase in the first quarter after posting solid gains in 2019. Forward-looking indicators of business spending, such as new orders of nondefense capital goods, excluding the volatile aircraft category, have plunged recently amid sharply lower business sentiment and profit expectations from industry analysts.
Change in real business fixed investment
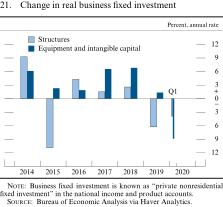
Business fixed investment is known as "private nonresidential fixed investment" in the national income and product accounts.
Source: Bureau of Economic Analysis via Haver Analytics.
. . . while corporate financing conditions have deteriorated
Financing conditions for nonfinancial firms were robust early in the year but tumbled during the global spread of COVID-19 (figure 22). The gross issuance of corporate bonds in the investment-grade segment was solid until late February, when it became intermittent at best as market functioning deteriorated. Meanwhile, issuance in the speculative-grade segment was essentially nonexistent following the broad risk-off sentiment in the market over the public health crisis. While investment-grade issuance recovered at a strong pace following the March Federal Reserve announcement on corporate credit funding facilities, high-yield issuance began to pick up only after the April announcement to expand the facilities to include support for some recent "fallen angels"—bonds downgraded to a speculative-grade credit rating from an investment-grade rating because of declining credit quality—and high-yield exchange-traded funds.14 The solvency outlook of corporate bonds for both the investment- and speculative-grade segments of the market dropped over the first half of the year as the pace of downgrades intensified and the volume of defaults picked up. Furthermore, the monthly volume of fallen angels reached a record high in March, and market analysts forecast this trend to continue with a record annual volume of debt being downgraded to high yield this year amid declining earnings and elevated leverage. Spreads on corporate bond yields over comparable-maturity Treasury securities have widened substantially amid worsening credit conditions. Institutional leveraged loan issuance volume was robust to start the first quarter, but it subsequently came to a standstill in March because of the pandemic. Newly launched volume increased somewhat starting in April but remains at subdued levels. Banks tightened standards and terms significantly on commercial and industrial (C&I) loans, according to respondents to the April SLOOS, and demand for C&I loans strengthened amid concerns about the pandemic. C&I loan growth at banks has picked up in the first half of the year, largely driven by soaring credit-line drawdowns since the beginning of March, as firms with existing credit lines sought to increase their internal cash buffers, and by lending to smaller businesses through the Paycheck Protection Program (PPP) since April.15
Selected components of net debt financing for nonfinancial businesses
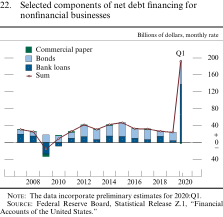
The data incorporate preliminary estimates for 2020:Q1.
Source: Federal Reserve Board, Statistical Release Z.1, "Financial Accounts of the United States."
Both exports and imports declined sharply in the first quarter
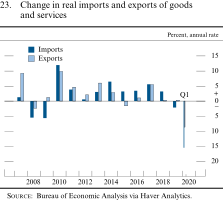
The sudden drop in global demand and production and stifled global value chains took a toll on international trade. U.S. real exports of goods and services in the first quarter declined at an annual rate of nearly 9 percent, as exports of services—including travel to the United States—plunged (figure 23). Real imports fell just over 15 percent, as U.S. consumers and firms cut back on spending, travel abroad halted, and shipments of imported goods were delayed. The trade deficit, relative to GDP, narrowed in the first quarter compared with 2019 (figure 24).
Change in real imports and exports of goods and services
Source: Bureau of Economic Analysis via Haver Analytics.
U.S. trade and current account balances
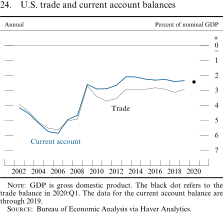
GDP is gross domestic product. The black dot refers to the trade balance in 2020:Q1. The data for the current account balance are through 2019.
Source: Bureau of Economic Analysis via Haver Analytics.
Federal fiscal stimulus will provide substantial support to economic activity in 2020 while also significantly boosting the budget deficit and debt...
Federal fiscal policy measures enacted in response to the pandemic have provided income support for households and businesses; increased grants-in-aid to state and local governments; and facilitated loans to businesses, households, states, and localities. The Congressional Budget Office (CBO) projects that in fiscal year 2020, the additional federal government expenditures and foregone revenues from these policies will total more than $2 trillion, around 10 percent of nominal GDP.16 (For a more detailed discussion of these policies, see the box "Federal Fiscal Policy Response to COVID-19.") In addition, the decline in economic activity has pushed down tax collections while pushing up outlays for certain transfer programs—most notably for unemployment insurance and Medicaid (figure 25). These tax decreases and transfer increases, working in tandem with the discretionary stimulus, will support aggregate demand and help blunt the extent of the economic downturn.
Federal receipts and expenditures
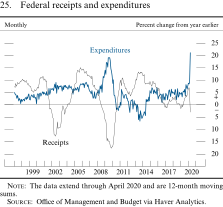
The data extend through April 2020 and are 12-month moving sums.
Source: Office of Management and Budget via Haver Analytics.
The combination of the discretionary stimulus measures and the response of receipts and expenditures to the decline in economic activity—referred to as automatic stabilizers—are expected to cause the budget deficit to balloon from its already elevated level. The CBO expects the federal unified budget deficit to widen from 4-1/2 percent of nominal GDP in fiscal 2019 to 18 percent of nominal GDP in fiscal 2020, the largest annual deficit as a share of GDP in the post–World War II era.17 The ratio of federal debt held by the public to nominal GDP is expected to rise from 79 percent in fiscal 2019 to 101 percent by the end of fiscal 2020, the highest debt-to-GDP ratio since 1947 (figure 26).
Federal government debt held by the public
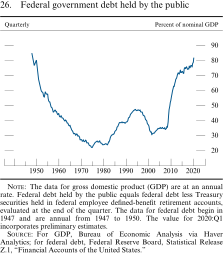
The data for gross domestic product (GDP) are at an annual rate. Federal debt held by the public equals federal debt less Treasury securities held in federal employee defined-benefit retirement accounts, evaluated at the end of the quarter. The data for federal debt begin in 1947 and are annual from 1947 to 1950. The value for 2020:Q1 incorporates preliminary estimates.
Source: For GDP, Bureau of Economic Analysis via Haver Analytics; for federal debt, Federal Reserve Board, Statistical Release Z.1, "Financial Accounts of the United States."
Federal Fiscal Policy Response to COVID-19
In response to the immense health and economic consequences of the COVID-19 pandemic, federal lawmakers have enacted a variety of measures. These measures are expected to raise government outlays and reduce tax revenues—the sum of which we refer to as fiscal support—by nearly $2-1/2 trillion over 10 years, of which about $2 trillion is expected in the current fiscal year, according to the Congressional Budget Office (CBO) (figure A, row 5). The legislation also included $454 billion for the Department of the Treasury to fund lending facilities established by the Federal Reserve and $46 billion to provide loans to the airline industry.1 Consistent with the historically large economic consequences resulting from the COVID-19 pandemic, the amount of fiscal support that has been enacted constitutes the fastest and largest fiscal response to any postwar economic downturn.
A. Fiscal support in response to COVID-19, by legislation
(billions of dollars)
Figure B breaks down the estimated fiscal support for fiscal year 2020 (figure A, column 1) into four broad categories: (1) direct aid to households, (2) loans or grants to small businesses, (3) other aid to businesses, and (4) government purchases of goods and services or grants to state and local governments.
Fiscal support in fiscal year 2020
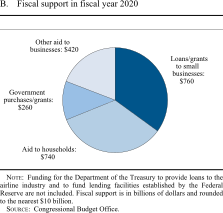
Funding for the Department of the Treasury to provide loans to the airline industry and to fund lending facilities established by the Federal Reserve are not included. Fiscal support is in billions of dollars and rounded to nearest $10 billion.
Source: Congressional Budget Office.
The rest of this discussion provides a brief overview of the main components of the four stimulus bills, focusing on the CBO's estimate of fiscal support (increased outlays minus reduced tax revenues) for fiscal 2020, organized by the four categories assigned in the figure.
Direct Aid to Households: $740 billion
The largest component of income support is roughly $290 billion in one-time payments to households. These stimulus checks provide households with a one-time refundable tax credit of $1,200 per adult and $500 per child 16 and under, with a phaseout at incomes between $75,000 and $100,000 for individuals and between $150,000 and $200,000 for couples. By the end of May, according to the Treasury Department, nearly all of the stimulus checks had been disbursed. The second major piece of household income support is $230 billion in expanded unemployment insurance (UI) benefits. UI benefits were increased by $600 per week through the end of July; eligibility was expanded through December for "gig" workers, the self-employed, and those who are unable to work as a result of the COVID-19 outbreak; and benefit durations were extended by 13 weeks through December. According to the CBO, around $70 billion in the more generous weekly benefits had been paid through the end of May. The legislation also provides student loan and mortgage relief, suspending loan payments and interest accrual on federal student loans until the end of September and reducing or suspending mortgage payments for mortgages backed by government-sponsored enterprises.2 Another component of the legislation provides federally mandated paid sick leave for workers at employers with fewer than 500 employees. The cost of the sick leave is rebated to employers through refundable payroll tax credits, which are expected to total about $90 billion in fiscal 2020. Employees are entitled to up to two weeks of paid leave equal to normal earnings for employees or family members who are directly affected by COVID-19 or COVID-19-related closures; additionally, employees are entitled to 10 weeks of paid leave at two-thirds normal pay for those caring for a child whose school or daycare is closed. In addition, about $90 billion in tax relief was provided to households in fiscal 2020, primarily through expanding the deductibility of certain business losses from individual tax liabilities.
Loans and Grants to Small Businesses: $760 billion
The Paycheck Protection Program provides about $670 billion in support to businesses with fewer than 500 employees through loans of up to 250 percent of monthly payroll costs before the crisis (subject to a cap of $10 million). These loans will be forgiven if employment and compensation are maintained relative to a pre-crisis level. In addition, small businesses are supported by about $90 billion in Small Business Administration (SBA) Economic Injury Disaster Loans and by six-month loan payment deferrals for new and existing SBA borrowers.
Other Aid to Businesses: $420 billion
Businesses are aided by several provisions that reduce tax revenues in fiscal 2020, with the largest reduction coming from delayed payment of employer-side payroll taxes until 2021 and 2022, which is expected to reduce tax payments by $210 billion in fiscal 2020 but mostly be made up in subsequent years. An additional roughly $90 billion reduction in fiscal 2020 tax liability results from modifications of the treatment of net operating losses and interest expenses for corporations. The legislation also provides nearly $50 billion in payroll tax relief for businesses significantly affected by COVID-19 shutdowns in order to retain employees. Aside from tax relief, about $20 billion in loans and grants are expected to go to passenger and cargo air carriers and related contractors to support payroll expenses for aviation workers affected by the pandemic. In addition, about $50 billion in funds are expected to go to hospitals to support health-care-related expenses or provide relief for lost revenues. Finally, while they do not show up in the CBO's estimates of fiscal support, the legislation provided up to $454 billion for the Treasury Department to fund lending facilities established by the Federal Reserve to offer loans to businesses as well as state and local governments and provided up to $46 billion to offer loans to the airline industry.
Direct Government Purchases and Aid to State and Local Governments: $260 billion
The largest part of this aid category consists of about $150 billion in relief funding to state and local governments for expenses related to dealing with the COVID-19 pandemic. State governments will also receive an extra $30 billion through a temporary increase in the share of Medicaid expenditures that the federal government covers. In addition, the Federal Emergency Management Agency is expected to spend $50 billion in disaster relief funds to provide assistance to individuals and organizations affected by the COVID-19 crisis.
. . . and state and local governments confront a fiscal crisis as tax revenue shrinks
A sharp reduction in tax revenues due to a collapse in income and retail sales tax revenue is placing significant stress on state governments. Local governments, which rely on more cyclically stable property taxes, will be somewhat less directly affected. Nevertheless, local governments rely on aid from their state governments, particularly for primary and secondary education, and the budget strains at the state level will therefore likely be passed down to localities. In April and May, state and local governments shed more than 1-1/2 million jobs as schools and universities closed early and local governments reduced their noneducation workforce. These state and local budget strains will be partially offset by grants from the federal government. (See the box "Federal Fiscal Policy Response to COVID-19" for further details.)
Risks to the outlook are greater than usual
The path ahead is extraordinarily uncertain. First and foremost, the pace of recovery will ultimately depend on the evolution of the COVID-19 outbreak in the United States and abroad and the measures undertaken to contain it. Importantly, some small businesses and highly leveraged firms might have to shut down permanently or declare bankruptcy, which could have longer-lasting repercussions on productive capacity. (For a more in-depth discussion of the potential consequences of the shutdowns on small businesses, see the box "Small Businesses during the COVID-19 Crisis.") In addition, there is uncertainty about future labor demand and productivity as firms shift their production processes to increase worker safety, realign their supply chains, or move services online. Furthermore, if employees are not called back to their former jobs, their period of unemployment could increase, potentially leading to lower wages when they do eventually find a job. Finally, applications for employer identification numbers, which are an early indicator of new business formations, are tracking well below levels from recent years and may suggest a slower pace of future job creation through this channel.
Small Businesses during the COVID-19 Crisis
Small businesses employ nearly half of U.S. private-sector workers, play key roles in local communities, and provide income to millions of business owners. The COVID-19 pandemic poses acute risks to the survival of many small businesses. Widespread failure of small businesses would create economic insecurity for millions of workers and business owners, slow down the economic recovery, and alter the economic landscape of local communities. The Congress, the Federal Reserve, and other federal agencies are making aggressive efforts to support small businesses.
More than 99 percent of U.S. firms have fewer than 500 employees, and almost 90 percent have fewer than 20 employees. Altogether, businesses with fewer than 500 employees account for almost half of private-sector jobs.1 Small businesses and small nonprofit organizations are particularly prevalent in service industries and include examples such as car dealers, restaurants, barber shops, medical offices, legal offices, home repair contractors, and religious organizations. These businesses and organizations are part of the economic and social landscape of local communities and neighborhoods. Small businesses are also prevalent in manufacturing supply chain industries.2 Moreover, the businesses that spur innovation, contribute to nationwide job and productivity growth, and turn into large household names typically start out as small businesses.3
Small businesses are particularly vulnerable to social distancing for two main reasons. First, small businesses are prevalent in sectors that have seen especially large declines in revenue due to social distancing; small businesses make up about 60 percent of employment in the "leisure and hospitality" sector and about 85 percent of employment in the "other services" sector (which includes assorted neighborhood fixtures like churches and beauty salons). Second, small firms tend to be more financially constrained than larger firms. For example, bank account data suggest that roughly half of small businesses entered the COVID-19 crisis with cash reserves sufficient for fewer than 15 days of operations without revenue.4 Moreover, even under normal circumstances, many small firms face financial challenges and lack access to liquid financial markets, relying instead on bank loans, credit cards, and the personal resources of owners.5
A wide variety of data reveal an alarming picture of small business health during the COVID-19 crisis. Surveys of small businesses suggest that pessimism about business viability is prevalent.6 The majority of small businesses have seen revenue losses, and half of small businesses do not expect to return to their usual level of operations within the next six months.7
Employment declines have been deeper among small businesses than among larger businesses (figure A).8 Moreover, the share of total job losses accounted for by small businesses stopping paycheck issuance entirely (that is, going inactive) is substantial (light blue areas in figure A). Data from Homebase, a provider of scheduling and time sheet services for small local businesses, show that between 30 and 40 percent of establishments in sectors deeply affected by social distancing have gone inactive since February 15.9 Data from Womply, a provider of credit card transaction processing services, suggest that spending at small restaurants was down 80 percent (versus a year earlier) by early April and was still down 50 percent in early June.10 Taken together, these data suggest considerable risk of failure for a large number of small businesses.
Change in employment, by firm size
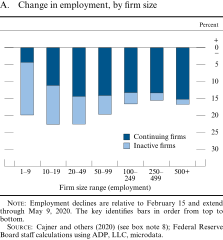
Employment declines are relative to February 15 and extend through May 9, 2020. The key identifies bars in order from top to bottom.
Source: Cajner and others (2020) (see box note 8); Federal Reserve Board staff calculations using ADP, LLC, microdata.
The inflow of new businesses (which are typically small businesses) also plummeted, as shown in figure B. The Census Bureau reports that, in late March, applications for new employer business tax identifiers were down more than 40 percent relative to a year earlier; the series has only gradually recovered and was still just below last year's pace as of late May. Business entry is a key contributor to job creation; with business exits and associated job destruction likely to be elevated during the COVID-19 episode, new firm creation is even more important than usual.11
New business applications
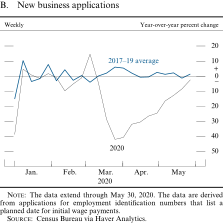
The data extend through May 30, 2020. The data are derived from applications for employment identification numbers that list a planned date for initial wage payments.
Source: Census Bureau via Haver Analytics.
The Congress, the Federal Reserve, and other federal agencies have acted swiftly to help address the risk of widespread small business failure. As part of the CARES Act (Coronavirus Aid, Relief, and Economic Security Act), the Congress created the Paycheck Protection Program (PPP) to provide small businesses with funds to retain employees for roughly two months. The Federal Reserve is bolstering the effectiveness of the PPP through the Paycheck Protection Program Liquidity Facility, which extends credit to eligible financial institutions to finance PPP loans. About three-fourths of small businesses with employees have applied for PPP assistance, suggesting the program is extremely valuable and timely, and a large share of these applications have been approved; however, some industries may face an ongoing need after the program expires.12
The Federal Reserve is also supporting lending to small businesses through the Term Asset-Backed Securities Loan Facility, which lends to holders of, among others, securities backed by loans guaranteed by the Small Business Administration. In addition, the Federal Reserve has established the Main Street Lending Program (MSLP), which features a range of facilities designed to provide support to small and medium-sized firms.13
Small businesses make vital contributions to labor markets and their local communities, and a critical subset of small businesses are young, innovative firms with the potential to create many jobs and increase overall productivity. The nature of the economic recovery that follows the COVID 19 crisis will depend in part on the survival of small businesses. Small business failures not only destroy jobs, but also erase the productive knowledge within the firms, deplete the assets of business owners, alter the character of communities and neighborhoods, and, in some cases, deprive the country of innovations. The Federal Reserve will continue to monitor the conditions of small businesses and support this fundamental segment of the economy.
Financial Developments
The expected path of the federal funds rate over the next several years has fallen to near zero
The expected path of the federal funds rate over the next several years has declined since early January and is now flat at the effective lower bound for the next few years (figure 27). Before the Federal Reserve lowered the target range for the federal funds rate to 0 to 1/4 percent in March, policy expectations dropped substantially in late February and early March as COVID-19 concerns intensified. Market-based measures suggest that the expected federal funds rate remains below 0.25 percent through mid-2023.18 Survey-based measures of the expected path of the policy rate also moved down from the levels observed at the end of 2019. According to the results of the Survey of Primary Dealers and Survey of Market Participants, both conducted by the Federal Reserve Bank of New York in April, the median of respondents' modal projections implies a flat trajectory for the target range of the federal funds rate at the effective lower bound for the next few years.19
Market-implied federal funds rate path
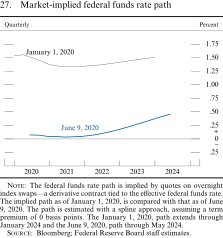
The federal funds rate path is implied by quotes on overnight index swaps–-a derivative contract tied to the effective federal funds rate. The implied path as of January 1, 2020, is compared with that as of June 9, 2020. The path is estimated with a spline approach, assuming a term premium of 0 basis points. The January 1, 2020, path extends through January 2024 and the June 9, 2020, path through May 2024.
Source: Bloomberg; Federal Reserve Board staff estimates.
The U.S. nominal Treasury yield curve has shifted down sharply...
After moving lower over the second half of 2019, nominal Treasury yields fell sharply in late February and early March as investors' concerns regarding the implications of the COVID-19 outbreak for the economic outlook led to both falling policy expectations and flight-to-safety flows, with longer-term Treasury security yields dropping to historically low levels (figure 28). Longer-term yields increased moderately and realized volatility spiked for a period in March as selling pressures grew, leading to dealer balance sheet capacity constraints and impaired trading conditions, before falling back again after the Federal Reserve's actions helped restore smooth market functioning. (See the box "Federal Reserve Actions to Ensure Smooth Functioning of Treasury and MBS Markets" in Part 2 for a more detailed description of the Treasury market during March.) More recently, yields on longer-term Treasury securities rose somewhat, linked at least partially to the expected increase in the issuance of longer-term Treasury securities as well as some improvement in investor sentiment. Options prices suggest that near-term uncertainty about longer-dated Treasury yields rose sharply in March to levels not seen since the Global Financial Crisis before retracing.
Yields on nominal Treasury securities
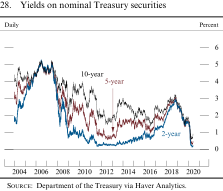
Source: Department of the Treasury via Haver Analytics.
. . . but spreads of other long-term debt to Treasury securities rose
Yields on 30-year agency MBS—an important determinant of mortgage interest rates—decreased somewhat, on balance, though less than the yields on nominal Treasury securities, since the start of the year and remained very low by historical standards (figure 29).
Yield and spread on agency mortgage-backed securities
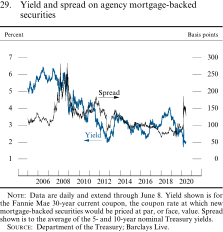
Data are daily and extend through June 8. Yield shown is for the Fannie Mae 30-year current coupon, the coupon rate at which new mortgage-backed securities would be priced at par, or face, value. Spread shown is to the average of the 5- and 10-year nominal Treasury yields.
Source: Department of the Treasury; Barclays Live.
Series: Yield and spread Horizon: January 3, 2005, to June 8, 2020 Description: A line chart with two curves over January 3, 2005, to June 8, 2020. Units are percent for the yield curve and basis points for the spread curve. The data are daily. The yield curve starts at about 5.1, increases to about 6.5 by mid-2006, decreases to about 3.5 by late 2008, increases to about 5 by mid-2009, drops to about 3 in late 2010, goes back up to about 4.5 in early 2011, and drops to about 2 by late 2012. It increases to about 3.75 by late 2013, decreases to about 2.5 by mid-2016, increases to about 4.1 by late 2018, and decreases to about 2 by mid-2020. The spread curve starts at about 110, remains about flat until late 2017, spikes to about 275 by 2008, decreases to about 125 by mid-2009, increases to about 175 by 2011, falls to about 75 by mid-2012, increases to about 150 by mid-2013, decreases to about 75 by the beginning of 2018, increases to about 100 by late 2019, spikes to about 180 in early 2020, and ends at about 130 in mid-2020.
Early in the year, yields on both investment- and speculative-grade corporate bonds as well as primary- and secondary-market municipal bonds were near record lows (figure 30). Spreads on corporate bond yields over comparable-maturity Treasury yields were in the lower end of their historical distribution. Since mid-February, corporate spreads have increased appreciably as market functioning deteriorated and credit quality declined. In March, spreads to comparable-maturity Treasury securities increased sharply for corporate debt but remained below those observed during the 2008 Global Financial Crisis. Spreads started to normalize following the Federal Reserve announcements of corporate bond facilities in late March, particularly for investment-grade corporate debt, but remain higher than at the end of 2019. Similarly, yields and spreads for municipal debt rose strikingly in March, with spreads to comparable-maturity Treasury securities spiking to their highest level since the Global Financial Crisis as market functioning declined and concerns about municipal credit quality arose. Yields on municipal debt partially recovered following Federal Reserve announcements in late March and April of support to municipal debt markets through liquidity facilities.
Corporate bond yields, by securities rating and municipal bond yield
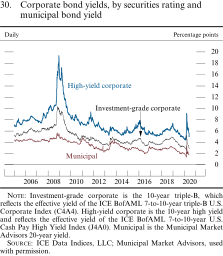
Investment-grade corporate is the 10-year triple-B, which reflects the effective yield of the ICE BofAML 7-to-10-year triple-B U.S. Corporate Index (C4A4). High-yield corporate is the 10-year high yield and reflects the effective yield of the ICE BofAML 7-to-10-year U.S. Cash Pay High Yield Index (J4A0). Municipal is the Municipal Market Advisors 20-year yield.
Source: ICE Data Indices, LLC; Municipal Market Advisors, used with permission.
Series: Investment-grade corporate, high-yield corporate, and municipal yield Horizon: January 4, 2005, to June 9, 2020 Description: A line chart with three curves over January 4, 2005, to June 9, 2020. Units are percentage points, and the data are daily. The investment-grade corporate curve starts at approximately 5.5, slowly increases to about 6.5 by late 2008, spikes to a peak of about 10.7 by the end of 2008, drops substantially to about 3.6 by late 2012, increases to 4.6 by the end of 2013, fluctuates fairly consistently between 3.6 and 4.9 through the end of 2019, dips to about 2.5 then increases to about 5.2 in early 2020, and ends at about 2.5. The high-yield corporate curve begins at about 6.5, rises to about 11 by late 2008, peaks at about 18.1 by the end of 2008, drops quickly to about 10 by the beginning of 2010, decreases gradually to about 4.5 by early 2020 with peaks of 9.5 in late 2011 and 8 in early 2016 and late 2018, spikes to 9 in early 2020, and drops to about 5 by mid-2020. The municipal yield curve starts around 4.2 and shows only a modest increase relative to the other two curves, peaking at about 4.5 by late 2008. It declines to about 2.2 by early 2013, picks up to about 3.8 by early 2014, dips to 2 in mid-2016, jumps to 3 by late 2016, gradually decreases to 1.5 by early 2020, spikes to 3.5, and ends at about 2 in mid-2020.
Liquidity in markets for Treasury securities and mortgage-backed securities deteriorated sharply before recovering following various Federal Reserve actions
A number of indicators of Treasury market functioning—including bid-ask spreads, bid sizes, estimates of transaction costs, and measures of market depth—deteriorated significantly in late February and March, but conditions improved considerably following Federal Reserve asset purchases and the creation of credit and liquidity facilities. (See the box "Federal Reserve Actions to Ensure Smooth Functioning of Treasury and MBS Markets" in Part 2.) Bid-ask spreads remain higher than those seen at the end of the year in the off-the-run market and for the 30-year bond in the on-the-run market, and market depth remains low. MBS spreads have fallen back markedly, but prepayment risk and uncertainty about forbearance continue to put upward pressure on spreads. Strains remain in some less liquid parts of the market.
Broad equity prices dropped notably amid the global spread of COVID-19 before rebounding
Equity prices continued to increase early in the year before tumbling in March, dropping as much as 34 percent from peak to trough. Prices have mostly recovered against a background of unprecedented, forceful, and rapid monetary and fiscal policy responses as well as recent tentative signs of economic revival associated with the easing of restrictions and in the face of bleak forecasts for U.S. firms' earnings in 2020 (figure 31). The decline in stock prices was widespread across all sectors, with the largest declines in the energy and banking sectors. Measures of implied and realized stock price volatility for the S&P 500 index—the VIX and the 20-day realized volatility—spiked to levels that were most recently observed during the financial crisis (figure 32). They have since retraced much of that increase but remain at elevated levels. (For a discussion of financial stability issues, see the box "Developments Related to Financial Stability.")
Equity prices
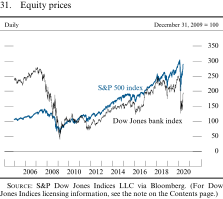
The data extend through June 18, 2020.
Source: S&P Dow Jones Indices LLC via Bloomberg. (For Dow Jones Indices licensing information, see the note on the Contents page.)
Series: Dow Jones bank index and S&P 500 index Horizon: January 4, 2005, to June 9, 2020 Description: A line chart with two curves. Units for all series have been indexed to 100 based on their respective values on December 31, 2009, and the data are daily. The Dow Jones bank index curve starts at around 240 in January 2005, rises to just under 300 by late 2007, declines sharply to about 50 by the beginning of 2009, rises noisily to around 250 by the end of 2019 with a peak of 250 in late 2017 and dips to 75 in late 2011 and 125 in early 2016, drops sharply to about 75 in early 2020, and rises to about 180 by mid-2020. The S&P 500 index curve starts at about 105 in 2005, rises slowly to about 150 by late 2017, drops to about 55 by the end of 2008, increases steadily to just over 300 by the end of 2019, drops sharply to about 200 in early 2020, and rises again to just under 300 by mid-2020.
S&P 500 volatility
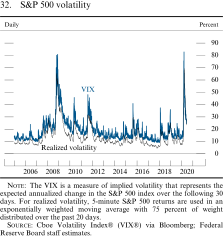
The VIX is a measure of implied volatility that represents the expected annualized change in the S&P 500 index over the following 30 days. For realized volatility, 5-minute S&P 500 returns are used in an exponentially weighted moving average with 75 percent of weight distributed over the past 20 days.
Source: Cboe Volatility Index® (VIX®) via Bloomberg; Federal Reserve Board staff estimates.
Series: Realized volatility and VIX Horizon: January 4, 2005, to June 9, 2020 Description: A line chart with two curves. Units for both series are in percent, and data are daily. The VIX series starts at around 15 in January 2005 and increases sharply to about 82 toward the end of 2008 into the beginning of 2009. The VIX curve drops to around 20 in January 2010 and gently decreases to 10 from 2010 to the end of 2017 aside from spikes to about 46 in mid-2010, about 48 in mid-2011, and 40 in late 2017. The VIX curve spikes to almost 40 in early and late 2018, fluctuates between 10 and 25 throughout 2019, spikes to about 85—similar to its level in 2008—in early 2020, drops sharply to 25, and then rises to about 40 by mid-2020. The realized volatility curve tracks the VIX curve closely but generally stays about 5 to 10 points lower.
While overnight money market rates generally moved down in line with decreases in the Federal Open Market Committee's target range, short-term funding markets experienced strains before the announcement and launch of Federal Reserve facilities
Decreases in the Federal Open Market Committee's (FOMC) target range for the federal funds rate in March transmitted effectively through overnight money markets, with yields on a broad set of money market instruments moving lower in response to the FOMC's policy actions. Over the first half of the year, the effective federal funds rate (EFFR) remained within the target range (figure 33). After printing at the top of the target range for a few days following the March 15 rate cut, the EFFR softened considerably to trade near the bottom of the range amid substantial increases in reserves. Though upward pressures on interest rates in overnight money markets were generally well contained during March, short-term funding markets experienced a liquidity squeeze. Certain other short-term interest rates, including those pertaining to commercial paper and negotiable certificates of deposit, moved up markedly. However, since the announcement and launch of the Federal Reserve liquidity facilities directed toward these markets, short-term funding rates have declined significantly.
Selected money market rates
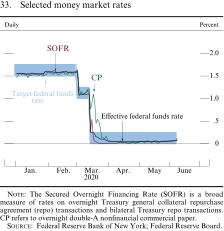
The Secured Overnight Financing Rate (SOFR) is a broad measure of rates on overnight Treasury general collateral repurchase agreement (repo) transactions and bilateral Treasury repo transactions. CP refers to overnight double-A nonfinancial commercial paper.
Source: Federal Reserve Bank of New York; Federal Reserve Board.
Bank credit continued to expand, while bank profitability declined
Aggregate credit provided by commercial banks trended up through the first half of 2020, driven largely by soaring C&I credit-line drawdowns since early March and by loans originated under the PPP since April (figure 34). While commercial real estate loan growth remained strong, growth in residential real estate loans on banks' balance sheets has slowed since the beginning of the year, and outstanding consumer loans contracted in April. First-quarter earnings reports of larger banks indicate that bank profitability declined considerably in the first quarter of 2020 because of narrower net interest margins and notable increases in loan loss provisions.20
Commercial and industrial loan growth
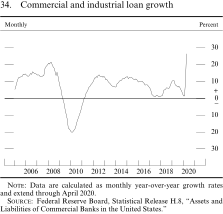
Data are calculated as monthly year-over-year growth rates and extend through April 2020.
Source: Federal Reserve Board, Statistical Release H.8, "Assets and Liabilities of Commercial Banks in the United States."
International Developments
Economic activity abroad plunged in the first half of the year
The spread of COVID-19 throughout the world and the measures taken to contain it have produced devastating effects on the global economy. Many countries closed nonessential businesses and restricted people's movement during the first months of the year, leading to a sharp global economic contraction. Foreign GDP declined at about a 13 percent annualized rate in the first quarter, and recent indicators point to an even larger contraction in the second quarter (figure 35). Available data suggest that the decline in foreign activity in the first half of the year has been greater than during the Global Financial Crisis.
Foreign real gross domestic product and composite output purchasing managers index
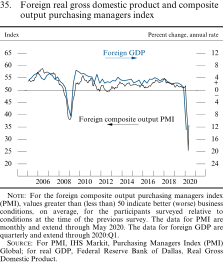
For the foreign composite output purchasing managers index (PMI), values greater than (less than) 50 indicate better (worse) business conditions, on average, for the participants surveyed relative to conditions at the time of the previous survey. The data for PMI are monthly and extend through May 2020. The data for foreign GDP are quarterly and extend through 2020:Q1.
Source: For PMI, IHS Markit, Purchasing Managers Index (PMI) Global; for real GDP, Federal Reserve Bank of Dallas, Real Gross Domestic Product.
Series: Foreign GDP and foreign composite output PMI Horizon: January 1, 2005, to May 31, 2020 Description: A line chart with two curves from January 1, 2005, to May 31, 2020. Units are annualized percent changes for foreign GDP. The GDP curve fluctuates between 4 and 6 from 2005 to 2007, spikes downward to negative 8 by the end of 2008, increases to 6 by the end of 2009, decreases steadily to 2 by the end of 2019, then decreases to negative 13 by early 2020. The composite output PMI starts about 54, increases to 59 by mid-2006, decreases to 37 by the end of 2008, increases to 55 by early 2010, fluctuates between 50 and 55 through 2019, plummets to 25 in early 2020, and ends at 35 in mid-2020.
The collapse in economic activity across countries followed the progression of the virus. In China, where regions underwent strict lockdowns as early as January, GDP in the first quarter dropped at a stunning 36 percent annualized rate (figure 36). As the virus spread to Europe, many countries in the region imposed strict social-distancing restrictions; euro-area GDP contracted nearly 14 percent in the first quarter of 2020. The substantial decline in commodity prices also depressed activity of commodity exporters such as Canada and several Latin American countries. Recent data indicate that Chinese production began to revive in the spring, as infection rates fell and restrictions were gradually lifted (figure 37). Indicators of Chinese consumption, however, remain weak. A number of advanced foreign economies (AFEs) began to relax social-distancing restraints in recent weeks.
Real gross domestic product in selected foreign economies
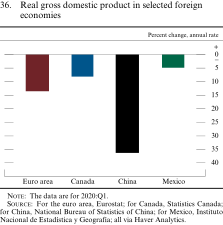
The data are for 2020:Q1.
Source: For the euro area, Eurostat; for Canada, Statistics Canada; for China, National Bureau of Statistics of China; for Mexico, Instituto Nacional de Estadística y Geografía; all via Haver Analytics.
Manufacturing output purchasing managers index in selected foreign economies
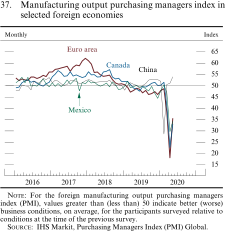
For the foreign manufacturing output purchasing managers index (PMI), values greater than (less than) 50 indicate better (worse) business conditions, on average, for the participants surveyed relative to conditions at the time of the previous survey.
Source: IHS Markit, Purchasing Managers Index (PMI) Global.
Series: Canada, China, euro area, and Mexico Horizon: January 1, 2016, to May 31, 2020 Description: A line chart with four curves over January 1, 2016, to May 31, 2020. The data are monthly. The euro-area curve begins at about 54, increases to about 60 in late 2017, decreases to about 46 at the end of 2019, decreases sharply to about 17 in early 2020, and ends at about 35 in mid-2020. The other three curves track closely with the euro-area curve but generally remain about 5 to 10 points lower until the end of 2018 and about 5 to 10 points higher afterward, with shallower spikes of 22 to 35 in early 2020. China experienced the 2020 downward spike and recovery about two months earlier than the other curves and ended at about 54 in mid-2020.
Labor market conditions deteriorated and inflation fell...
Amid widespread business closures and collapsing demand, labor market conditions abroad have deteriorated sharply in recent months, albeit with differences across countries. Several European and Asian countries have thus far experienced sizable declines in hours worked but relatively small increases in unemployment given the size of the drop in economic activity, partly reflecting direct wage subsidies provided by the governments to keep workers on firms' payrolls (figure 38). In other countries, unemployment rates increased markedly.
Unemployment rate in selected advanced economies
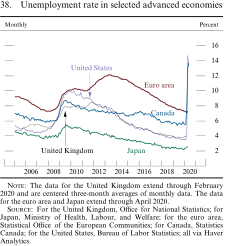
The data for the United Kingdom extend through February 2020 and are centered three-month averages of monthly data. The data for the euro area and Japan extend through April 2020.
Source: For the United Kingdom, Office for National Statistics; for Japan, Ministry of Health, Labour, and Welfare; for the euro area, Statistical Office of the European Communities; for Canada, Statistics Canada; for the United States, Bureau of Labor Statistics; all via Haver Analytics.
Although the shutdowns across the world have reduced the global supply of goods and services, the depressive effects on demand of lower income, social distancing, and increased uncertainty have predominated, driving down inflation in the foreign economies. In several AFEs, recent inflation readings have been well below central bank targets, reflecting large declines in energy prices as well as subdued core inflation (figure 39).
Consumer price inflation in selected advanced foreign economies
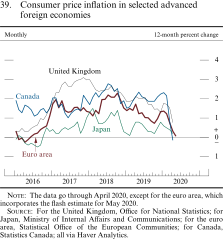
The data go through April 2020, except for the euro area, which incorporates the flash estimate for May 2020.
Source: For the United Kingdom, Office for National Statistics; for Japan, Ministry of Internal Affairs and Communications; for the euro area, Statistical Office of the European Communities; for Canada, Statistics Canada; all via Haver Analytics.
. . . prompting swift and substantial policy responses
Foreign fiscal authorities have aimed to fill income gaps resulting from businesses closing and workers staying home. Many national governments acted decisively to support firms' balance sheets through tax deferrals, loans, and loan guarantees; to encourage firms to retain workers through wage subsidies; and to support household spending through enhanced unemployment benefits and cash transfers.
In addition, many foreign central banks reduced their policy rates, initiated or enhanced credit facilities, and relaxed capital requirements for financial institutions. Several AFE central banks also ramped up asset purchase programs to alleviate liquidity strains in their domestic capital markets. Some emerging market economy (EME) central banks followed suit. See the box "Policy Response to COVID-19 in Foreign Economies" for a more detailed discussion of fiscal and monetary policies implemented abroad.
Policy Response to COVID-19 in Foreign Economies
Authorities in foreign economies have announced a wide array of fiscal, monetary, and regulatory measures to mitigate disruptions caused by the COVID-19 pandemic.
Many foreign governments have enacted sizable fiscal packages to address the sudden loss of income by firms and households, with a special focus on the most vulnerable groups, such as low-income individuals, the unemployed, and small and medium-sized enterprises. The size of the support is, on average, considerably larger in advanced foreign economies (AFEs) than in emerging market economies (EMEs), as many EME governments have more limited fiscal space.
The measures targeted at firms aim to keep them afloat in the near term, with the hope of preserving businesses until demand returns. Such measures include loans at favorable terms and loan guarantees; deferrals of taxes and social security contributions; tax breaks and cash transfers, especially for small and medium-sized enterprises; and targeted sectoral support. For households, the measures aim to provide income to those in need and alleviate payment difficulties. These policies include increased unemployment and pension payments, mortgage deferrals, accelerated transfer payments, and direct cash payments. In addition, several AFEs and some Asian emerging economies have adopted large direct wage subsidies to keep workers on firms' payrolls. Such measures may help limit dislocations in the labor markets of these countries by subsidizing a significant reduction in hours worked. The hope of these programs is that workers' continued attachment to their firms will preserve human capital and make it readily available to the firms during the recovery that follows the crisis.
Many central banks have reduced their policy rates (figure A)—often to or near their effective lower bounds—and have taken substantial actions to start or expand asset purchases and to support the flow of credit. Although central banks acted quickly to lower interest rates, some policymakers in the EMEs expressed concerns about intensifying capital outflows, while a few AFE central banks worried about the potential harm to banks' financial health.
Cumulative policy rate cuts by selected central banks
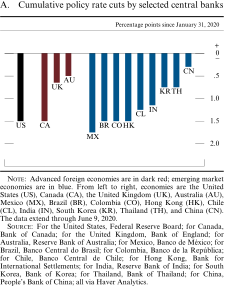
Advanced foreign economies are in dark red; emerging market economies are in blue. From left to right, economies are the United States (US), Canada (CA), the United Kingdom (UK), Australia (AU), Mexico (MX), Brazil (BR), Colombia (CO), Hong Kong (HK), Chile (CL), India (IN), South Korea (KR), Thailand (TH), and China (CN). The data extend through June 9, 2020.
Source: For the United States, Federal Reserve Board; for Canada, Bank of Canada; for the United Kingdom, Bank of England; for Australia, Reserve Bank of Australia; for Mexico, Banco de México; for Brazil, Banco Central do Brasil; for Colombia, Banco de la República; for Chile, Banco Central de Chile; for Hong Kong, Bank for International Settlements; for India, Reserve Bank of India; for South Korea, Bank of Korea; for Thailand, Bank of Thailand; for China, People's Bank of China; all via Haver Analytics.
Several AFE central banks have purchased government debt in response to the crisis. These purchases have been primarily aimed at restoring market functioning and providing liquidity, but the purchases have also eased financial conditions by lowering long-term yields. The Bank of England (BOE) restarted its purchases of gilts, and the Swedish Riksbank increased the pace of its existing program. The European Central Bank (ECB) and the Reserve Bank of New Zealand introduced and expanded asset purchase programs. The Reserve Bank of Australia (RBA) began bond purchases to target the three-year government bond yield at 0.25 percent, the same as its overnight rate. Some central banks, such as the Bank of Canada (BOC) and the RBA, have started purchases of provincial and state bonds to support liquidity in those markets. To ensure the smooth transmission of its monetary actions, the ECB has used its flexibility to weight its purchases more heavily toward bonds of euro-area member states that face higher yields.
Monetary authorities have also adopted policies to sustain the provision of credit to businesses and households during the pandemic. Central banks have purchased a variety of private assets, thus directly addressing distress in funding markets and helping ease financial conditions for firms. These assets include corporate bonds purchased by the BOE, ECB, and Bank of Japan (BOJ); commercial paper bought by the BOC, BOE, BOJ, and Riksbank; and exchange-traded funds and real estate investment trusts purchased by the BOJ. These actions have significantly expanded the balance sheets of major foreign central banks (figure B). Some central banks in EMEs have also begun purchasing private assets, with the central banks of Chile and Colombia buying bank bonds.
Central bank assets for selected advanced economies
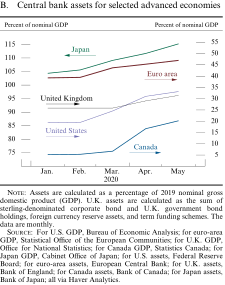
Assets are calculated as a percentage of 2019 nominal gross domestic product (GDP). U.K. assets are calculated as the sum of sterling-denominated corporate bond and U.K. government bond holdings, foreign currency reserve assets, and term funding schemes. The data are monthly.
Source: For U.S. GDP, Bureau of Economic Analysis; for euro-area GDP, Statistical Office of the European Communities; for U.K. GDP, Office for National Statistics; for Canada GDP, Statistics Canada; for Japan GDP, Cabinet Office of Japan; for U.S. assets, Federal Reserve Board; for euro-area assets, European Central Bank; for U.K. assets, Bank of England; for Canada assets, Bank of Canada; for Japan assets, Bank of Japan; all via Haver Analytics.
Series: Canada, euro area, Japan, United Kingdom, and United States Horizon: January 2020 to May 2020 Description: A line chart with five curves over January 2020 to May 2020. Units are percent of nominal GDP, and the data are monthly. The Canada curve begins at about 5, is flat through March, then increases to about 20 by May. The euro-area curve starts at about 40 and increases to about 45 by May, with the biggest increase between February and March. The Japan curve begins at about 105 and increases smoothly to about 115 by May. The U.K. curve begins at about 25, is flat through March, then increases to about 32 by May. The U.S. curve begins at about 20, is flat through February, then increases steadily to about 34 in May.
Several central banks have also activated funding-for-lending facilities to provide relatively inexpensive funding to banks as long as they maintain defined lending benchmarks, in some cases with extra incentives to lend to small and medium-sized enterprises. The BOE, BOJ, ECB, RBA, Riksbank, and Bank of Korea currently have such programs.
Regulators in a number of foreign economies have introduced various measures that provide relief for banks to help sustain their capacity to absorb pandemic-related losses while continuing to lend to the economy. These measures include temporarily easing capital requirements, such as the reduction—and, in some cases, elimination—of conservation and countercyclical capital buffers; deferring the implementation of new, stricter Basel capital requirements; temporarily easing liquidity requirements (for example, in France, Germany, and the United Kingdom); and giving banks and their supervisors more flexibility in dealing with nonperforming loans (for example, the ECB). In addition, some regulators have temporarily excluded central bank reserves and certain safe assets from the calculation of leverage exposures. Some foreign regulators are considering the reduction or even elimination of risk weights on new loans guaranteed by the government. Regulators also emphasize that banks should continue to apply sound underwriting standards and conduct solid capital and liquidity planning and robust risk management.
Downside risks remain high
Despite aggressive fiscal and monetary policy actions, risks abroad are skewed to the downside. The future progression of the pandemic remains highly uncertain, with resurgence of the outbreak a substantial risk. In addition, the economic damage of the recession may be quite persistent. The collapse in demand may ultimately bankrupt many businesses, thereby reducing business dynamism and innovation. Unlike past recessions, services activity has dropped more sharply than manufacturing—with restrictions on movement severely curtailing expenditures on travel, tourism, restaurants, and recreation—and social-distancing requirements and attitudes may further weigh on the recovery in these sectors. Disruptions to global trade may also result in a costly reconfiguration of global supply chains. Persistently weak consumer and firm demand may push medium- and longer-term inflation expectations well below central bank targets, particularly in regions with already low inflation at the onset of the recession. Finally, additional expansionary fiscal policies—possibly in response to future large-scale outbreaks of COVID-19—could significantly increase government debt and add to sovereign risk, especially for countries with already limited fiscal space.
Financial conditions abroad tightened, especially in some emerging market economies
The precipitous spread of COVID-19 in the first months of the year weighed heavily on global risk sentiment, and many financial markets suffered from severe illiquidity. Aggressive fiscal and monetary policy responses in the United States and abroad, however, helped boost sentiment and improve market functioning, contributing to a partial retracement. On net, financial conditions abroad remain tighter than at the beginning of the year, especially in some EMEs.
Financial conditions in the AFEs largely tracked financial market developments in the United States. Major AFE equity indexes dropped substantially as news about the spread of COVID-19 and the associated measures to contain it were reported, but those indexes rebounded following the announcement of extraordinary monetary and fiscal policy actions and, more recently, tentative signs of economic stabilization (figure 40). Notwithstanding temporary increases due to poor market functioning, long-term sovereign yields in major advanced economies fell, on net, as flight-to-safety demand surged, policy rates reached their effective lower bounds in several countries, and expectations of future policy rates declined markedly (figure 41). Sovereign interest rates for economies in the euro-area periphery were sensitive to news about the size and form of European-wide fiscal support for the recovery and, on net, remain a bit higher than at the beginning of the year (figure 42). In recent months, Fitch and DBRS Morningstar downgraded Italy's long-term debt ratings.
Equity indexes for selected advanced economies
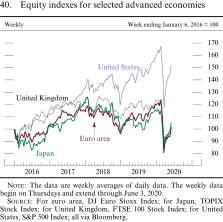
The data are weekly averages of daily data. The weekly data begin on Thursdays and extend through June 3, 2020.
Source: For euro area, DJ Euro Stoxx Index; for Japan, TOPIX Stock Index; for United Kingdom, FTSE 100 Stock Index; for United States, S&P 500 Index; all via Bloomberg.
Series: Euro area, Japan, United Kingdom, and United States Horizon: January 1, 2016, to June 3, 2020 Description: A line chart with four curves over January 1, 2016, to June 3, 2020. Units are an index with the week ending January 8, 2016, equal to 100, and data are weekly averages of daily data. The euro-area curve begins at 100, increases to about 120 by the end of 2017, fluctuates between 95 and about 120 through 2019, spikes down to 80 in early 2020, then ends at about 100 in mid-2020. The Japan curve tracks closely with the euro-area curve. The U.K. curve follows a similar path as well; it begins at 100, increases to 120 in mid-2017, fluctuates between 110 and 130 through the end of 2019, spikes downward to 80 in early 2020, and rises to about 105 by mid-2020. The U.S. curve again follows a similar path, but with a higher trajectory. It begins at 100, increases to about 140 by mid-2018, falls to about 120 in late 2018, rises to almost 170 in late 2019, spikes downward to about 120 in early 2020, and ends at about 150 in mid-2020.
Nominal 10-year government bond yields in selected advanced economies
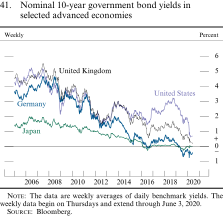
The data are weekly averages of daily benchmark yields. The weekly data begin on Thursdays and extend through June 3, 2020.
Source: Bloomberg.
Series: Japan, Germany, United Kingdom, and United States 10-year benchmark yields Horizon: January 1, 2005, to June 3, 2020 Description: A line chart with four curves over January 1, 2005, to June 3, 2020. Units are percent, and data are weekly averages of daily benchmark yields. The Japan curve begins at about 1.5, rises to nearly 2 in 2006, declines steadily to 0 through 2015, and fluctuates near 0 through mid-2020. The Germany, U.K., and U.S. curves all vary significantly at short timescales. The Germany curve begins just below 4, fluctuates between 3 and 5 through 2008, decreases to about 2 by mid-2010, rises to nearly 4 by the end of 2010, decreases to just above 0 by 2014, fluctuates between 0 and 1 through 2018, and fluctuates between 0 and negative 1 from 2018 to mid-2020. The U.S. curve begins just above 4, increases to about 5 by the end of 2006, decreases to about 2 in mid-2008, increases to about 4 by the end of 2009, decreases to just above 1 by the end of 2011, increases to about 3 through 2013, decreases to about 2 by 2016, rises to about 3 in 2018, and falls to just below 1 by mid-2020. The U.K. curve follows a similar path to the United States, only diverging significantly in the 2016 to 2020 period. It decreases to below 1 in 2016, rises to nearly 2 in mid-2018, and decreases to near 0 by mid-2020.
Nominal 10-year government bond yields in selected euro-area economies
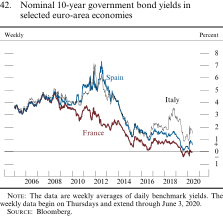
The data are weekly averages of daily benchmark yields. The weekly data begin on Thursdays and extend through June 3, 2020.
Source: Bloomberg.
Series: France, Italy, and Spain Horizon: January 1, 2005, to June 3, 2020 Description: A line chart with four curves over January 1, 2005, to June 3, 2020. Units are percent, and data are weekly averages of daily benchmark yields. The France curve begins just below 4, increases to about 5 through mid-2008, decreases to about 3 by mid-2010, increases to about 4 in early 2011, decreases steadily to just above 0 through 2014, fluctuates between 0 and 1 through mid-2019, fluctuates at slightly below 0 through the end of 2019, and rises to slightly above 0 in early 2020 before ending at about 0 in mid-2020. The Spanish curve starts just below 4, rises to about 5 by mid-2008, fluctuates between 4 and 5 through 2010, rises to more than 7 in 2012, steadily declines to about 1 at the end of 2014, fluctuates between about 1 and 2 through 2018, and fluctuates between 0 and 1 through mid-2020, ending at about 0.5. The Italy curve tracks the Spanish curve closely from the beginning until 2017, at which point it increases to about 4 by mid-2018, decreases to 1 by mid-2019, and rises to about 2 by mid-2020.
Financial conditions in some EMEs tightened, especially in Latin American countries. Equity indexes suffered widespread losses early in the year, and rebounds since then have been uneven across countries. While equity indexes in emerging Asia partially recovered, Mexican and Brazilian equity indexes underperformed other EME equities (figure 43). In March, borrowing rates for corporations increased to levels not seen since the Global Financial Crisis, although they have subsequently declined somewhat. In the first half of the year, funds dedicated to investing in EMEs experienced outflows, and sovereign borrowing spreads increased sharply before moving down more recently (figure 44). The tightening in some EME financial conditions appears to reflect investors' preference for safe and liquid assets; a reduced confidence in the ability of some governments to contain the health crisis; and heightened uncertainty about the prospects for EME public finances, commodity prices, and global trade.
Equity indexes for selected emerging market economies
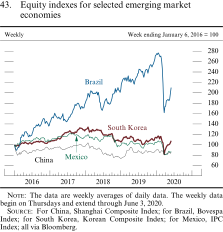
The data are weekly averages of daily data. The weekly data begin on Thursdays and extend through June 3, 2020.
Source: For China, Shanghai Composite Index; for Brazil, Bovespa Index; for South Korea, Korean Composite Index; for Mexico, IPC Index; all via Bloomberg.
Series: Brazil, China, Mexico, and South Korea Horizon: January 1, 2016, to June 3, 2020 Description: A line chart with four curves over January 1, 2016, to June 3, 2020. Units are an index with the week ending January 6, 2016, equal to 100. Data are weekly averages of daily data. The curves all start at 100. The curve for Brazil shows the greatest volatility, increasing to about 280 by the end of 2019, dropping sharply to about 160 in early 2020, and increasing to about 210 by mid-2020. The curve for China remains below the others until early 2020, fluctuating between about 75 and 100 with peaks of about 100 in early 2018 and early 2019 and a low of about 75 at the end of 2018, and reaches about 90 in mid-2020. The curves for South Korea and Mexico remain moderately flat between about 100 and 140 through 2019, with South Korea slightly above Mexico except in 2016 to early 2017 and briefly near the end of 2018. The two curves diverge the most in late 2017 and early 2018, with South Korea averaging about 130 and Mexico 115. The curves for South Korea and Mexico drop to 80 in early 2020, and South Korea rises to about 100 by mid-2020 while Mexico remains fairly flat to end at about 90 in mid-2020.
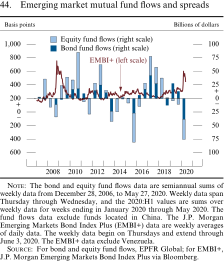
The dollar appreciated
The foreign exchange value of the dollar increased nearly 5 percent since the start of the year, as the boost from safe-haven demand outweighed the effects of lower U.S. interest rates (figure 45). On a trade-weighted basis, the dollar increased about 1.5 percent against AFE currencies and 7 percent against EME currencies. The Mexican peso and Brazilian real depreciated about 16 percent and 30 percent, respectively, partly in response to lower commodity prices. The Chinese renminbi fluctuated largely in response to news about the outbreak and policy actions of Chinese authorities and, on net, depreciated slightly since the beginning of the year.
U.S. dollar exchange rate indexes
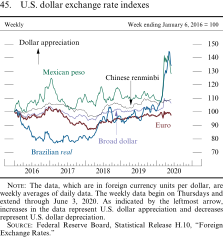
The bond and equity fund flows data are semiannual sums of weekly data from December 28, 2006, to May 27, 2020. Weekly data span Thursday through Wednesday, and the 2020:H1 values are sums over weekly data for weeks ending in January 2020 through May 2020. The fund flows data exclude funds located in China. The J.P. Morgan Emerging Markets Bond Index Plus (EMBI+) data are weekly averages of daily data. The weekly data begin on Thursdays and extend through June 3, 2020. The EMBI+ data exclude Venezuela.
Source: For bond and equity fund flows, EPFR Global; for EMBI+, J.P. Morgan Emerging Markets Bond Index Plus via Bloomberg.
Footnotes
Monetary Policy
The Federal Open Market Committee quickly reduced the federal funds rate to the effective lower bound...
In light of the effects of COVID-19 on the economy and on risks to the outlook, the Federal Open Market Committee (FOMC) lowered the target range for the federal funds rate by a total of 1-1/2 percentage points—from a range of 1-1/2 to 1-3/4 percent to one of 0 to 1/4 percent—over two meetings in early and mid-March (figure 46).21 Specifically, in early March, the Committee lowered the target range for the federal funds rate 1/2 percentage point, to 1 to 1-1/4 percent. In mid-March, the Committee further lowered the target range 1 percentage point, to 0 to 1/4 percent. The Committee expects to maintain this target range until it is confident that the economy has weathered recent events and is on track to achieve its maximum-employment and price- stability goals. In connection with the changes in the target range, the Federal Reserve reduced the interest paid on reserve balances and decreased the interest rate offered on overnight reverse repurchase agreements at the two March meetings.
Selected interest rates
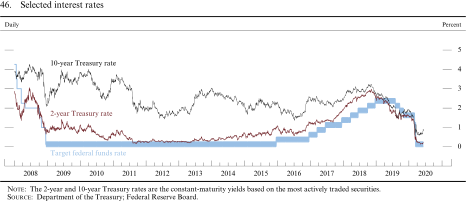
The 2-year and 10-year Treasury rates are the constant-maturity yields based on the most actively traded securities.
Source: Department of the Treasury; Federal Reserve Board.
. . . and the FOMC increased the holdings of Treasury securities and agency mortgage-backed securities in the System Open Market Account
At its mid-March meeting, along with its decision to lower the target range for the federal funds rate, the FOMC emphasized that it is prepared to use its full range of tools to support the flow of credit to households and businesses, thereby promoting its maximum-employment and price-stability goals. To support the smooth functioning of markets for Treasury securities and agency mortgage-backed securities (MBS)—markets central to the flow of credit to households and businesses—the Committee announced that it would increase its holdings of Treasury securities by at least $500 billion and its holdings of agency MBS by at least $200 billion over coming months (figure 47). (See the box "Federal Reserve Actions to Ensure Smooth Functioning of Treasury and MBS Markets.") Later in March, the Committee announced that it would continue to purchase Treasury securities and agency MBS in the amounts needed to support smooth market functioning and the effective transmission of monetary policy to broader financial conditions (figure 48). The Committee also included agency commercial MBS in its purchases for the first time. In June, the Committee announced that, over coming months, the Federal Reserve will increase its holdings of Treasury securities and agency residential and commercial MBS at least at the current pace to sustain smooth market functioning, thereby fostering effective transmission of monetary policy to broader financial conditions.
Federal Reserve open market operations
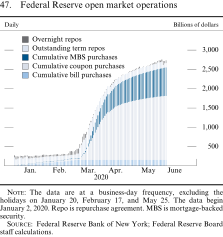
The data are at a business-day frequency, excluding the holidays on January 20, February 17, and May 25. The data begin January 2, 2020. Repo is repurchase agreement. MBS is mortgage-backed security.
Source: Federal Reserve Bank of New York; Federal Reserve Board staff calculations.
Series: Overnight repos, outstanding term repos, cumulative MBS purchases, cumulative coupon purchases, and cumulative bill purchases Horizon: January 2, 2020, to June 9, 2020 Description: A stacked bar chart with five series over January 2, 2020, to June 9, 2020. Units are billions of dollars, and the data are daily. The data for overnight repos start at about 30 and fluctuate between about 20 and 150, with the highest values in mid-March. Outstanding term repos start at about 210 for the first two days, then range mostly from about 100 to 270, with the highest values in mid-March. Cumulative MBS purchases start very small but quickly increase to about 110 by mid-March and continue to grow rapidly, ending at around 740. Cumulative coupon purchases start at around 3 and grow slowly before increasing sharply in late March and early April to about 1000. The series continues to grow and ends at about 1700. Cumulative bill purchases begin at about 10, grow steadily to about 160 by mid-February, and remain at that level through the end of the series.
Federal Reserve assets and liabilities
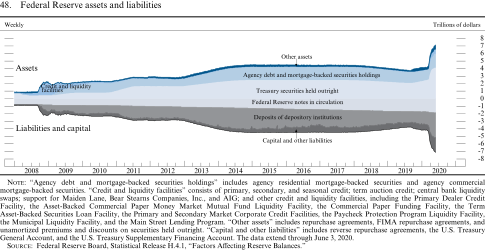
"Agency debt and mortgage-backed securities holdings" includes agency residential mortgage-backed securities and agency commercial mortgage-backed securities. "Credit and liquidity facilities" consists of primary, secondary, and seasonal credit; term auction credit; central bank liquidity swaps; support for Maiden Lane, Bear Stearns Companies, Inc., and AIG; and other credit and liquidity facilities, including the Primary Dealer Credit Facility, the Asset-Backed Commercial Paper Money Market Mutual Fund Liquidity Facility, the Commercial Paper Funding Facility, the Term Asset-Backed Securities Loan Facility, the Primary and Secondary Market Corporate Credit Facilities, the Paycheck Protection Program Liquidity Facility, the Municipal Liquidity Facility, and the Main Street Lending Program. "Other assets" includes repurchase agreements, FIMA repurchase agreements, and unamortized premiums and discounts on securities held outright. "Capital and other liabilities" includes reverse repurchase agreements, the U.S. Treasury General Account, and the U.S. Treasury Supplementary Financing Account. The data extend through June 3, 2020.
Source: Federal Reserve Board, Statistical Release H.4.1, "Factors Affecting Reserve Balances."
The Federal Reserve has continued rolling over at auction all principal payments from its holdings of Treasury securities. Before mid-March, to allow for a gradual runoff of agency securities, the Federal Reserve reinvested principal payments from agency debt and agency MBS of up to $20 billion per month in Treasury securities; agency MBS principal payments in excess of $20 billion each month were reinvested in agency MBS. Beginning in mid-March, the Committee announced it would reinvest all principal payments from the Federal Reserve's holdings of agency debt and agency MBS back into agency MBS. (The box "Developments on the Federal Reserve's Balance Sheet" discusses changes in the size and composition of the Federal Reserve's balance sheet over the past year.)
Federal Reserve Actions to Ensure Smooth Functioning of Treasury and MBS Markets
Deterioration in Market Functioning in February and March
Between late February and early March, functioning in U.S. Treasury securities and agency mortgage-backed securities (MBS) markets became increasingly strained. Amid growing concerns about the economic implications of COVID-19, investors sought to sell large volumes of long-maturity Treasury securities and MBS and reallocate their portfolios into shorter-term, more liquid assets. While the yields on long-maturity Treasury securities initially dropped sharply, in mid-March they started to increase in the face of these strong selling pressures (figure A). Around the same time as the increase in long-maturity Treasury yields, the spreads between yields on MBS and Treasury securities of comparable duration widened sharply. Indications of severe dislocations in both markets were also present. For example, bid-ask spreads for Treasury securities and agency MBS widened significantly (figure B shows indicative Treasury bid-ask spreads).
Nominal Treasury yields
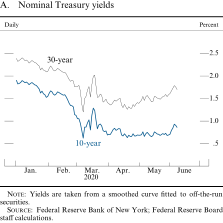
Yields are taken from a smoothed curve fitted to off-the-run securities.
Source: Federal Reserve Bank of New York; Federal Reserve Board staff calculations.
Federal Reserve Treasury purchases and indicative Treasury bid-ask spreads
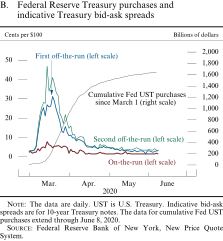
The data are daily. UST is U.S. Treasury. Indicative bid-ask spreads are for 10-year Treasury notes. The data for cumulative Fed UST purchases extend through June 8, 2020.
Source: Federal Reserve Bank of New York, New Price Quote System.
One factor that may explain these market dislocations is the effect of widespread selling of Treasury securities and MBS to primary dealers, who intermediate a large proportion of trading in these markets. As a wide range of domestic and foreign investors (including foreign official investors) rushed to raise cash or rebalance their portfolios by selling assets, dealers took large amounts of less liquid securities, including off-the-run Treasury securities and agency MBS, onto their balance sheets. At the same time, mortgage refinancing picked up, prompting substantial turnover in the MBS market. By early March, some dealers had reportedly run into balance sheet constraints that hampered their ability to purchase additional securities, leading to a deterioration in the functioning of a number of dealer-intermediated markets.
In the market for Treasury securities, liquidity conditions were particularly poor for more seasoned, or "off the run," securities. However, the most liquid parts of the market, where newly issued, or "on the run," securities are traded electronically, saw unprecedented strains: The volume of posted quotes, or "market depth," dropped sharply, while intraday bid-ask spreads were exceptionally volatile, particularly for the longest-maturity securities. These strains in the most liquid part of the market suggest that principal trading firms—market participants who specialize in high-frequency and automated intermediation—were significantly less active than usual.
Federal Reserve Policy Actions
The disruptions to the functioning of the Treasury and MBS markets were notable in view of the status of these markets as cornerstones for the operation of the U.S. and global financial systems and for the transmission of monetary policy. The Federal Reserve therefore took a series of policy measures designed to ensure the smooth functioning of these markets. These measures included the expansion of repurchase operations, an increase in purchases of Treasury and agency MBS securities, the expansion of financing arrangements for primary dealers, and a temporary change to the regulatory capital requirements of bank holding companies and depository institutions.
Beginning March 9, 2020, following a directive from the Federal Open Market Committee (FOMC), the Federal Reserve Bank of New York's Open Market Desk increased the size of overnight and term repurchase operations in order to ensure that the supply of reserves remained ample and to support the smooth functioning of the markets in which primary dealers obtain a substantial proportion of their short-term funding.1 These changes expanded the supply of short-term funding available to primary dealers to finance their increased holdings of Treasury securities and agency MBS at a time when funding costs from other sources were increasing. Further, on March 12, the Desk introduced new weekly recurring one- and three-month term repurchase agreement (repo) operations of up to $500 billion to address the disruption in Treasury financing markets.2 Finally, on March 16, the Desk introduced a second daily overnight repo operation and increased the amount offered in each to $500 billion.3 Usage of Federal Reserve repo operations peaked on March 17, with overnight and term repo outstanding of $496 billion, and has since fallen to $167 billion as funding strains have eased. In light of more stable repo market conditions, on May 4, the Desk returned to once daily overnight repo operations.4 Further, on May 14, the Desk discontinued its three-month term repo operations.5
Despite the much larger volume of repo operations during the week of March 9, strains in Treasury and agency MBS markets continued to build. Beginning in mid-March, therefore, the FOMC directed the Desk to purchase Treasury securities and agency MBS in order to support smooth market functioning. On March 15, the FOMC directed the Desk to increase its holdings of Treasury securities by at least $500 billion and of agency MBS by at least $200 billion, with purchases to take place across maturities.6 To provide greater flexibility in addressing the strains, on March 23, the FOMC authorized purchases of these securities in the amounts needed to support smooth market functioning and effective transmission of monetary policy to broader financial conditions. The securities targeted for purchase were also expanded to include agency commercial MBS. Since mid-March, the Desk has purchased approximately $1.6 trillion and $719 billion of Treasury securities and agency MBS, respectively.7 The daily amounts of purchases peaked at approximately $75 billion and $41 billion for Treasury securities and agency MBS, respectively, in late March before being reduced in stages to the current average daily amounts of around $4.0 billion for Treasury securities and $4.5 billion for agency MBS (including reinvestments). These purchases helped reduce financial market volatility by providing a predictable source of demand for these securities and by taking up some of the inventories from dealers' balance sheets.
On March 17, the Board, with the approval of the U.S. Treasury Secretary, established the Primary Dealer Credit Facility (PDCF) to provide primary dealers with access to term funding against a broad range of collateral.8 The PDCF helped alleviate funding pressures faced by primary dealers by allowing them to source financing more easily for their increased securities holdings. The amount of PDCF loans outstanding peaked at around $35 billion in mid-April but has since declined to around $6 billion.
On March 31, the Federal Reserve announced the establishment of the temporary FIMA (Foreign and International Monetary Authorities) Repo Facility to allow FIMA account holders, which consist of central banks and other international monetary authorities with accounts at the Federal Reserve Bank of New York, to exchange their Treasury securities for U.S. dollars.9 This facility allows foreign official institutions to raise U.S. dollars, if needed, without having to sell Treasury securities in the open market during periods of heightened volatility or impaired market functioning. Since its inception, take-up of the facility has been modest, as stresses in the U.S. Treasury market have declined.
On April 1, the Federal Reserve released an interim final rule indicating that holdings of U.S. Treasury securities and deposits at Federal Reserve Banks by bank holding companies would be excluded from the calculation of the supplementary leverage ratio (SLR) until March 31, 2021.10 Further, on May 15, 2020, the federal bank regulatory agencies (the Board of Governors, Federal Deposit Insurance Corporation, and Office of the Comptroller of the Currency) released an interim final rule allowing depository institutions that are subject to the SLR the option to similarly exclude U.S. Treasury securities and deposits at Federal Reserve Banks from their SLR calculations through March 31, 2021.11 These temporary exemptions are expected to ease liquidity pressures for primary dealers and depository institutions subject to these leverage ratios by providing them with greater flexibility to intermediate trades with clients in the presence of temporarily larger inventories of Treasury securities.
Improvements in Market Functioning
Since the announcement of these policy actions, trading conditions in the markets for Treasury securities and MBS have improved steadily. The purchases of Treasury securities and agency MBS contributed to the subsequent decline in primary dealers' inventories (figure C). Bid-ask spreads have narrowed, particularly in the case of on-the-run Treasury securities, while MBS spreads have also come down from their peaks in mid-March. In addition to the Federal Reserve's actions, the passage of the CARES Act (Coronavirus Aid, Relief, and Economic Security Act), together with an improvement in sentiment among investors regarding the economic implications of COVID-19, likely contributed to the improvement in market functioning. In late May, these inventories temporarily increased to levels previously seen in March, largely because of increased dealer holdings of Treasury bills. However, Treasury markets did not exhibit a recurrence of the notable strains in trading conditions witnessed earlier this year.
Net dealer inventories and indicative bid-ask spreads
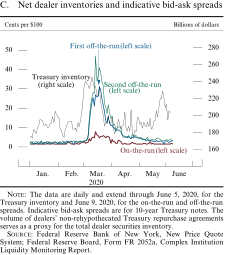
The data are daily and extend through June 5, 2020, for the Treasury inventory and June 9, 2020, for the on-the-run and off-the-run spreads. Indicative bid-ask spreads are for 10-year Treasury notes. The volume of dealers' non-rehypothecated Treasury repurchase agreements serves as a proxy for the total dealer securities inventory.
Source: Federal Reserve Bank of New York, New Price Quote System; Federal Reserve Board, Form FR 2052a, Complex Institution Liquidity Monitoring Report.
Series: Treasury inventory, first off-the-run, second off-the-run, and on-the-run Horizon: January 2, 2020, to June 9, 2020 Description: A line chart with four curves over January 2, 2020, to June 9, 2020. Units are cents per $100 for the three bid-ask spread curves and billions of dollars for the Treasury inventory curve. The data are daily. All three bid-ask spread curves start around 1 and begin increasing in March. The on-the-run curve jumps close to 10 in March and ends at about 1 in June. The first off-the-run curve peaks at around 30 in March and ends around 2. The second off-the-run curve spikes to about 50 in March and ends at about 2. The Treasury inventory curve begins at about 180 and peaks at around 245 in March before declining to about 180 in early April. It then increases to around 230 in late May before decreasing again to end at about 200.
Although trading conditions have improved substantially since mid-March, bid-ask spreads for longer-maturity and off-the-run Treasury securities remain wider than in mid-February. Market depth for on-the-run securities remains low, particularly for longer-maturity securities. MBS market functioning and liquidity have largely returned to pre-February norms, though strains remain in some less liquid parts of the market.
Developments on the Federal Reserve's Balance Sheet
The Size of the Federal Reserve's Balance Sheet Has Increased Considerably
In response to the financial and economic disruptions caused by the COVID-19 pandemic, the Federal Reserve has eased the stance of monetary policy and has deployed various tools to promote smooth functioning of financial markets and the flow of credit to households and businesses. This discussion reviews the implications of these actions for the Federal Reserve's balance sheet.
To support the smooth functioning of those credit markets that are critical for the economy, the Federal Reserve purchased Treasury securities and agency residential and commercial mortgage-backed securities (MBS), expanded repurchase agreement (repo) operations, and introduced several credit and liquidity facilities. As a result of these actions, the size of the Federal Reserve's balance sheet increased from $4.2 trillion at the beginning of 2020, approximately 19 percent of U.S. nominal gross domestic product (GDP), to $7.2 trillion in June 2020, approximately 33 percent of U.S. nominal GDP.1 The $3 trillion increase in the size of the balance sheet was driven by asset purchases and other extraordinary actions (figure A).2
A. Balance sheet comparison
(Billions of dollars)
Open Market Operations, the Discount Window, and U.S. Dollar Liquidity Swap Lines
Since the beginning of 2020, System Open Market Account holdings of Treasury securities and agency MBS increased by $1,805 billion and $427 billion, respectively.3 The markets for both Treasury securities and agency MBS play a critical role in the U.S. economy, and the Federal Reserve's purchases have fostered a substantial improvement in the functioning of these markets and the conditions prevailing in them.4
Furthermore, to address strains in short-term U.S. dollar funding markets, the Federal Reserve Bank of New York's Open Market Desk expanded its offerings of overnight and term repo operations. The amount of repos outstanding reached a peak of $442 billion in mid-March. Subsequently, given the improvement in funding market conditions, the Desk announced several reductions in the frequency of repo operations. As of June 3, all repos outstanding had declined to $212 billion, lower than the amount outstanding early in the year, amid substantial increases in reserves and improved funding market conditions.
On March 15, the Federal Reserve announced changes to the discount window and encouraged depository institutions to use the discount window to meet unexpected funding needs and support the flow of credit to households and businesses.5 The changes include lowering the primary credit rate by 150 basis points to 0.25 percent and extending borrowing terms for up to 90 days. The total outstanding discount window primary credit borrowing peaked at around $51 billion in late March and has since declined to $11 billion in June. Furthermore, the Federal Reserve maintains standing dollar liquidity swap line agreements with the central banks of several countries and instituted temporary agreements with the central banks of additional countries. After initially ramping up to $439 billion in March and April, the total agreements outstanding stayed mostly flat in May to reach $447 billion as of June 3 (figure B).
Federal Reserve assets
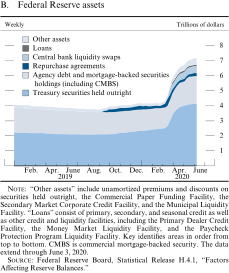
"Other assets" include unamortized premiums and discounts on securities held outright, the Commercial Paper Funding Facility, the Secondary Market Corporate Credit Facility, and the Municipal Liquidity Facility. "Loans" consist of primary, secondary, and seasonal credit as well as other credit and liquidity facilities, including the Primary Dealer Credit Facility, the Money Market Liquidity Facility, and the Paycheck Protection Program Liquidity Facility. Key identifies areas in order from top to bottom. CMBS is commercial mortgage-backed security. The data extend through June 3, 2020.
Source: Federal Reserve Board, Statistical Release H.4.1, "Factors Affecting Reserve Balances."
Lending Programs and Liquidity Facilities under Section 13(3) of the Federal Reserve Act
In addition to the open market operations and initiatives described earlier, the Federal Reserve further expanded measures to enhance liquidity and the flow of credit to U.S. households and businesses. Under the authority of section 13(3) of the Federal Reserve Act, with the approval of the Secretary of the Treasury, the Federal Reserve Board implemented various measures in response to intensified stresses in several markets.6 The combined size of the Money Market Mutual Fund Liquidity Facility and the Primary Dealer Credit Facility increased to $86 billion in April, but the size of the facilities declined to $36 billion by June 3. The combined size of other facilities, such as the Paycheck Protection Program Lending Facility, the Commercial Paper Funding Facility, the Secondary Market Corporate Credit Facility, and the Municipal Liquidity Facility, has been steadily rising and reached $65 billion as of June 3 (figure C).7
C. Liquidity and credit market facilities
The Expansion of Total Assets Led to Higher Reserve Balances Held by Depository Institutions
The increase in the Federal Reserve's assets led to a commensurate increase in the size of liabilities on the Federal Reserve's balance sheet. The expansion of total assets from the outright purchases and other actions resulted in reserve balances of $3.3 trillion, an increase of $1.7 trillion from the beginning of the year. Additionally, several nonreserve liabilities increased. In March and April, Federal Reserve notes grew faster than normal, partially in response to the COVID-19 pandemic, and reached $1.9 trillion, an increase of $144 billion from the beginning of the year.
Furthermore, the U.S. Treasury's General Account (TGA) at the Federal Reserve, which the Treasury uses to receive taxes and proceeds of Treasury auctions and to process the government's outlays, increased substantially. At the beginning of 2020, the TGA balance was approximately $400 billion. In preparation for the fiscal spending related to the CARES Act (Coronavirus Aid, Relief, and Economic Security Act) and other stimulus measures, the TGA balance reached a high of $1.4 trillion on June 3 (figure D).8
Federal Reserve liabilities
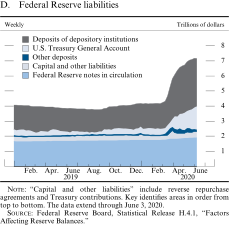
"Capital and other liabilities" include reverse repurchase agreements and Treasury contributions. Key identifies areas in order from top to bottom. The data extend through June 3, 2020.
Source: Federal Reserve Board, Statistical Release H.4.1, "Factors Affecting Reserve Balances."
The Federal Reserve eased lending terms for primary credit borrowing...
Primary credit is the Federal Reserve lending program available to depository institutions in generally sound financial condition. Amid increasing stress in funding markets in mid-March, the Federal Reserve announced several changes to the primary credit program. Importantly, the primary credit rate was set at the top of the target range for the federal funds rate rather than 50 basis points above the top of the range. The term of primary credit loans, which had previously been mainly overnight advances, was extended to allow depository institutions to borrow for up to 90 days. Federal Reserve communication encouraged the use of the discount window to help meet the demand for credit from households and businesses.
Discount window borrowing under the primary credit program increased significantly following these developments. Primary credit outstanding reached a peak of around $50 billion in late March 2020—its highest level since the financial crisis and well above the typical level of around $10 million that prevailed in 2019. Use of primary credit was fairly widespread, with discount window loans being extended to institutions across a range of size categories. Overall, the outstanding amount of primary credit loans declined to about $10 billion by early June.
. . . and undertook actions with other central banks to support U.S. dollar funding markets
The Federal Reserve announced coordinated actions with other central banks to enhance the provision of liquidity via the standing U.S. dollar liquidity swap line arrangements and the establishment of temporary U.S. dollar liquidity arrangements (swap lines) with nine additional central banks. (See the box "Developments Related to Financial Stability" in Part 1 for a more detailed discussion of the swap lines.) The size of the swap lines increased from close to zero in mid-March to almost $450 billion by the end of April. The Federal Reserve also established a temporary repo facility for foreign and international monetary authorities.
The FOMC is committed to using its tools to promote maximum employment and price stability
The ongoing public health crisis will weigh heavily on economic activity, employment, and inflation in the near term and pose considerable risks to the economic outlook over the medium term. The FOMC is committed to using its full range of tools to support the U.S. economy in this challenging time, thereby promoting its maximum-employment and price-stability goals. The Committee will continue to monitor the implications of incoming information for the economic outlook, including information related to public health, as well as global developments and muted inflation pressures, and it will use its tools and act as appropriate to support the economy.
The Federal Reserve has continued to review its strategic framework for monetary policy
In 2019, the Federal Reserve began a broad review of the monetary policy strategy, tools, and communication practices it uses to pursue its statutory dual-mandate goals of maximum employment and price stability. A key component of the review was a series of public Fed Listens events. The Federal Reserve held 14 events around the country in 2019 to consult with a range of organizations on the effects that labor market conditions, inflation, and interest rates have on them and their communities. In light of the rapidly changing public health and economic environments due to COVID-19, the Federal Reserve convened another event in May 2020 to get an update. The Federal Reserve has released a report on its Fed Listens initiative.22 The lessons learned from the Fed Listens initiative were never more important than they are today as Americans navigate through these challenging times. The Federal Reserve expects to complete the review of its monetary policy strategy, tools, and communication practices later this year. The Federal Reserve remains focused on the attainment of its goals of maximum employment and price stability, including laying the foundation for the return to a strong labor market.
Footnotes
Summary of Economic Projections
In conjunction with the Federal Open Market Committee (FOMC) meeting held on June 9–10, 2020, meeting participants submitted their projections of the most likely outcomes for real gross domestic product (GDP) growth, the unemployment rate, and inflation for each year from 2020 through 2022 and over the longer run. Each participant's projections were based on information available at the time of the meeting, together with his or her assessment of appropriate monetary policy and assumptions about other factors likely to affect economic outcomes. The longer-run projections represent each participant's assessment of the value to which each variable would be expected to converge, over time, under appropriate monetary policy and in the absence of further shocks to the economy.23 "Appropriate monetary policy" is defined as the future path of policy that each participant deems most likely to foster outcomes for economic activity and inflation that best satisfy his or her individual interpretation of the Federal Reserve's congressionally mandated goals of promoting maximum employment and price stability.
All participants judged that the uncertainty attending their projections was higher than the average of the past 20 years. The median of participants' projections for real GDP growth was negative 6.5 percent for 2020, with individual projections ranging from negative 10.0 to negative 4.2 percent table 1 and figure 1. The median of projections for real GDP growth was 5.0 percent for 2021 and 3.5 percent for 2022. The median assessment of real GDP growth in the longer run was 1.8 percent, down 0.1 percentage point since the December 2019 projections included in the February 2020 Monetary Policy Report.
Table 1. Economic projections of Federal Reserve Board members and Federal Reserve Bank presidents, under their individual assumptions of projected appropriate monetary policy, June 2020
Percent
Medians, central tendencies, and ranges of economic projections, 2020–22 and over the longer run
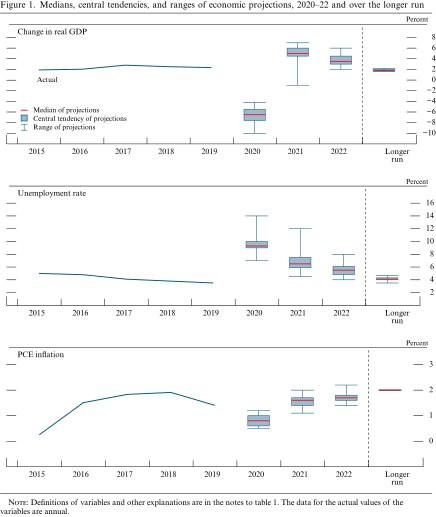
The median of projections for the unemployment rate in the fourth quarter of 2020 was 9.3 percent, with individual projections ranging from 7.0 to 14.0 percent. The median of projections for the unemployment rate was 6.5 percent and 5.5 percent in the fourth quarter of 2021 and 2022, respectively. These values are above the median assessment of the longer-run normal unemployment rate, 4.1 percent, which was unchanged from December.
The median of projections for inflation, as measured by changes in the price index for personal consumption expenditures (PCE), was 0.8 percent for 2020, 1.6 percent for 2021, and 1.7 percent for 2022. Almost all participants expected inflation to run below the Committee's longer-run objective of 2 percent through 2022. The medians of projections for core PCE inflation were 1.0 percent for this year, 1.5 percent for 2021, and 1.7 percent for 2022.
With regard to participants' projections of appropriate monetary policy, almost all participants expected to maintain the target range for the federal funds rate at 0 to 1/4 percent through at least the end of 2022 (figure 2). These projections represent participants' individual assessments of appropriate policy consistent with their projections of economic growth, employment, inflation, and other factors. However, the economic outlook is inherently uncertain; thus, each participant's assessment of appropriate policy is also necessarily uncertain and will change in response to changes to the economic outlook and associated risks. The median estimate of the longer-run level for the federal funds rate, 2.5 percent, was unchanged from December.
FOMC participants' assessments of appropriate monetary policy: Midpoint of target range or target level for the federal funds rate
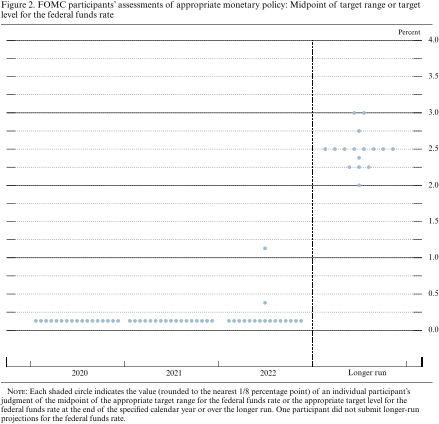
Each shaded circle indicates the value (rounded to the nearest 1/8 percentage point) of an individual participant's judgment of the midpoint of the appropriate target range for the federal funds rate or the appropriate target level for the federal funds rate at the end of the specified calendar year or over the longer run. One participant did not submit longer-run projections for the federal funds rate.
A more complete description of the Summary of Economic Projections will be released with the minutes of the June 9–10, 2020, FOMC meeting on July 1. A more complete description of the Summary of Economic Projections will be released with the minutes of the June 9–10, 2020, FOMC meeting on July 1.