February 2017 Monetary Policy Report: Full Text
Summary
Labor market conditions continued to strengthen over the second half of 2016. Payroll employment has continued to post solid gains, averaging 200,000 per month since last June, a touch higher than the pace in the first half of 2016, though down modestly from its 225,000-per-month pace in 2015. The unemployment rate has declined slightly since mid-2016; the 4.8 percent reading in January of this year was in line with the median of Federal Open Market Committee (FOMC) participants’ estimates of its longer-run normal level. The labor force participation rate has edged higher, on net, since midyear despite a structural trend that is moving down as a result of changing demographics of the population. In addition, wage growth seems to have picked up somewhat relative to its pace of a few years ago.
Consumer price inflation moved higher last year but remained below the FOMC’s longer-run objective of 2 percent. The price index for personal consumption expenditures (PCE) increased 1.6 percent over the 12 months ending in December, 1 percentage point more than in 2015, importantly reflecting that energy prices have turned back up and declines in non-oil import prices have waned. The PCE price index excluding food and energy items, which provides a better indication than the headline index of where overall inflation will be in the future, rose 1.7 percent over the 12 months ending in December, about 1/4 percentage point more than its increase in 2015. Meanwhile, survey-based measures of longer-run inflation expectations have remained generally stable, though some are at relatively low levels; market-based measures of inflation compensation have moved up in recent months but also are at low levels.
Real gross domestic product is estimated to have increased at an annual rate of 2 3/4 percent in the second half of the year after rising only 1 percent in the first half. Consumer spending has been expanding at a moderate pace, supported by solid income gains and the ongoing effects of increases in wealth. The housing market has continued its gradual recovery, and fiscal policy at all levels of government has provided a modest boost to economic activity. Business investment had been weak for much of 2016 but posted larger gains toward the end of the year. Notwithstanding a transitory surge of exports in the third quarter, the underlying pace of exports has remained weak, a reflection of the appreciation of the dollar in recent years and the subdued pace of foreign economic growth.
Domestic financial conditions have generally been supportive of economic growth since mid-2016 and remain so despite increases in interest rates in recent months. Long-term Treasury yields and mortgage rates moved up from their low levels earlier last year but are still quite low by historical standards. Broad measures of stock prices rose, and the financial sector outperformed the broader equity market. Spreads of yields of both speculative- and investment-grade corporate bonds over yields of comparable-maturity Treasury securities declined from levels that were somewhat elevated relative to the past several years. Even with an ongoing easing in mortgage credit standards, mortgage credit is still relatively difficult to access for borrowers with low credit scores, undocumented income, or high debt-to-income ratios. Student and auto loans are broadly available, including to borrowers with nonprime credit scores, and the availability of credit card loans for such borrowers appears to have expanded somewhat over the past several quarters. In foreign financial markets, meanwhile, equities, bond yields, and the exchange value of the U.S. dollar have all risen, and risk spreads have generally declined since June.
Financial vulnerabilities in the U.S. financial system overall have continued to be moderate since mid-2016. U.S. banks are well capitalized and have sizable liquidity buffers. Funding markets functioned smoothly as money market mutual fund reforms took effect in October. The ratio of household debt to income has changed little in recent quarters and is still far below the peak level it reached about a decade ago. Nonfinancial corporate business leverage has remained elevated by historical standards even though outstanding riskier corporate debt declined slightly last year. In addition, valuation pressures in some asset classes increased, particularly late last year. The Federal Reserve has continued to take steps to strengthen the financial system, including finalizing a rule that imposes total loss-absorbing capacity and long-term debt requirements on the largest internationally active bank holding companies as well as concluding an extensive review of its stress-testing and capital planning programs.
In December, the FOMC raised the target for the federal funds rate to a range of 1/2 to 3/4 percent after maintaining it at 1/4 to 1/2 percent for a year. The decision to increase the federal funds rate reflected realized and expected labor market conditions and inflation. With the stance of monetary policy remaining accommodative, the Committee has anticipated some further strengthening in labor market conditions and a return of inflation to the Committee’s 2 percent objective.
The Committee has continued to emphasize that, in determining the timing and size of future adjustments to the target range for the federal funds rate, it will assess realized and expected economic conditions relative to its objectives of maximum employment and 2 percent inflation. The Committee has expected that economic conditions will evolve in a manner that will warrant only gradual increases in the federal funds rate, and that the federal funds rate will likely remain, for some time, below levels that are expected to prevail in the longer run. Consistent with this outlook, in the most recent Summary of Economic Projections (SEP), which was compiled at the time of the December meeting of the FOMC, most participants projected that the appropriate level of the federal funds rate would be below its longer-run level through 2018. (The December SEP is included as Part 3 of this report.)
With respect to its securities holdings, the Committee has stated that it will continue to reinvest principal payments from its securities portfolio, and that it expects to maintain this policy until normalization of the level of the federal funds rate is well under way. This policy of keeping the Committee’s holdings of longer-term securities at sizable levels should help sustain accommodative financial conditions.
Statement on Longer-Run Goals and Monetary Policy Strategy
The Federal Open Market Committee (FOMC) is firmly committed to fulfilling its statutory mandate from the Congress of promoting maximum employment, stable prices, and moderate long-term interest rates. The Committee seeks to explain its monetary policy decisions to the public as clearly as possible. Such clarity facilitates well-informed decisionmaking by households and businesses, reduces economic and financial uncertainty, increases the effectiveness of monetary policy, and enhances transparency and accountability, which are essential in a democratic society.
Inflation, employment, and long-term interest rates fluctuate over time in response to economic and financial disturbances. Moreover, monetary policy actions tend to influence economic activity and prices with a lag. Therefore, the Committee’s policy decisions reflect its longer-run goals, its medium-term outlook, and its assessments of the balance of risks, including risks to the financial system that could impede the attainment of the Committee’s goals.
The inflation rate over the longer run is primarily determined by monetary policy, and hence the Committee has the ability to specify a longer-run goal for inflation. The Committee reaffirms its judgment that inflation at the rate of 2 percent, as measured by the annual change in the price index for personal consumption expenditures, is most consistent over the longer run with the Federal Reserve’s statutory mandate. The Committee would be concerned if inflation were running persistently above or below this objective. Communicating this symmetric inflation goal clearly to the public helps keep longer-term inflation expectations firmly anchored, thereby fostering price stability and moderate long-term interest rates and enhancing the Committee’s ability to promote maximum employment in the face of significant economic disturbances. The maximum level of employment is largely determined by nonmonetary factors that affect the structure and dynamics of the labor market. These factors may change over time and may not be directly measurable. Consequently, it would not be appropriate to specify a fixed goal for employment; rather, the Committee’s policy decisions must be informed by assessments of the maximum level of employment, recognizing that such assessments are necessarily uncertain and subject to revision. The Committee considers a wide range of indicators in making these assessments. Information about Committee participants’ estimates of the longer-run normal rates of output growth and unemployment is published four times per year in the FOMC’s Summary of Economic Projections. For example, in the most recent projections, the median of FOMC participants’ estimates of the longer-run normal rate of unemployment was 4.8 percent.
In setting monetary policy, the Committee seeks to mitigate deviations of inflation from its longer-run goal and deviations of employment from the Committee’s assessments of its maximum level. These objectives are generally complementary. However, under circumstances in which the Committee judges that the objectives are not complementary, it follows a balanced approach in promoting them, taking into account the magnitude of the deviations and the potentially different time horizons over which employment and inflation are projected to return to levels judged consistent with its mandate.
The Committee intends to reaffirm these principles and to make adjustments as appropriate at its annual organizational meeting each January.
Domestic Developments
Labor market conditions continued to improve during the second half of last year and early this year. Payroll employment has increased 200,000 per month, on average, since June, and the unemployment rate has declined slightly further, reaching 4.8 percent in January, in line with the median of Federal Open Market Committee (FOMC) participants’ estimates of its longer-run normal level. The labor force participation rate has edged higher, on net, which is all the more notable given a demographically induced downward trend. Labor market conditions continued to improve during the second half of last year and early this year. Payroll employment has increased 200,000 per month, on average, since June, and the unemployment rate has declined slightly further, reaching 4.8 percent in January, in line with the median of Federal Open Market Committee (FOMC) participants’ estimates of its longer-run normal level. The labor force participation rate has edged higher, on net, which is all the more notable given a demographically induced downward trend.
The 12-month change in the price index for overall personal consumption expenditures (PCE) was 1.6 percent in December--still below the Committee’s 2 percent objective but up noticeably from 2015, when the increase in top-line prices was held down by declines in energy prices. The 12-month change in the index excluding food and energy prices (the core PCE price index) was 1.7 percent last year. Measures of longer-term inflation expectations have been generally stable, though some survey-based measures remain lower than a few years ago; market-based measures of inflation compensation moved higher in recent months but also remain below their levels from a few years ago. The 12-month change in the price index for overall personal consumption expenditures (PCE) was 1.6 percent in December--still below the Committee’s 2 percent objective but up noticeably from 2015, when the increase in top-line prices was held down by declines in energy prices. The 12-month change in the index excluding food and energy prices (the core PCE price index) was 1.7 percent last year. Measures of longer-term inflation expectations have been generally stable, though some survey-based measures remain lower than a few years ago; market-based measures of inflation compensation moved higher in recent months but also remain below their levels from a few years ago.
Real gross domestic product (GDP) is estimated to have increased at an annual rate of 2 3/4 percent over the second half of 2016 after increasing just 1 percent in the first half. The economic expansion continues to be supported by accommodative financial conditions--including the still-low cost of borrowing for many households and businesses--and gains in household net wealth, which has been boosted further by a rise in the stock market in recent months and by increases in households’ real income spurred by continuing job gains. However, net exports were a moderate drag on GDP growth in the second half, as imports picked up and the rise in the exchange value of the dollar in recent years remained a drag on export demand. Real gross domestic product (GDP) is estimated to have increased at an annual rate of 2 3/4 percent over the second half of 2016 after increasing just 1 percent in the first half. The economic expansion continues to be supported by accommodative financial conditions--including the still-low cost of borrowing for many households and businesses--and gains in household net wealth, which has been boosted further by a rise in the stock market in recent months and by increases in households’ real income spurred by continuing job gains. However, net exports were a moderate drag on GDP growth in the second half, as imports picked up and the rise in the exchange value of the dollar in recent years remained a drag on export demand.
The labor market has continued to tighten gradually...
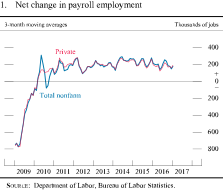
Labor market conditions strengthened over the second half of 2016 and early this year. Payroll employment has continued to post solid gains, averaging 200,000 per month since last June (figure 1). This rate of job gains is a bit higher than that seen during the first half of 2016, though it is a little slower than the 225,000 monthly pace in 2015. The unemployment rate has declined slightly further, on net, since the middle of last year. After dipping as low as 4.6 percent in November, the unemployment rate stood at 4.8 percent in January, in line with the median of FOMC participants’ estimates of its longer-run normal level.
The labor force participation rate, at 62.9 percent, is up slightly since June 2016. Changing demographics and other longer-run structural changes in the labor market likely have continued to put downward pressure on the participation rate. A flat or increasing trajectory of the participation rate should therefore be viewed as a cyclical improvement relative to that downward trend. Reflecting the slightly higher participation rate and the small drop in the unemployment rate, the employment-to-population ratio has moved up about 1/4 percentage point since mid-2016 (figure 2). (For additional historical context on the economic recovery, see the box “The Recovery from the Great Recession and Remaining Challenges.”)
Net change in payroll employment
Source: Department of Labor, Bureau of Labor Statistics.
Labor force participation rate and employment-to-population ratio
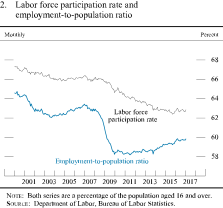
Both series are a percentage of the population aged 16 and over.
Source: Department of Labor, Bureau of Labor Statistics.
The Recovery from the Great Recession and Remaining Challenges
The Great Recession severely affected the U.S. economy...
The Great Recession of 2008 and 2009, and the financial crisis that precipitated it, resulted in massive job losses and falling incomes for American households. The Great Recession was, along many dimensions, the most severe downturn since the Great Depression almost 80 years earlier. Economic output declined outright for 18 months, leaving real gross domestic product (GDP) 4 1/2 percent below its previous peak. More than 8 1/2 million jobs were lost, on net, and the unemployment rate soared from 4 1/2 percent in 2007 to a peak of 10 percent in late 2009 (text figure 3). The labor force participation rate (LFPR), the fraction of the population either employed or counted as unemployed, fell steeply, from 66 percent in 2007 to 63 percent in 2014 (text figure 2). Household incomes tumbled, with real income for the median family declining more than 8 percent from 2007 to 2012.
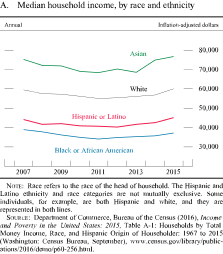
The hardships were particularly acute for certain groups of Americans. As text figure 4 shows, unemployment rates for blacks and Hispanics rose considerably more during the recession than did such rates for the nation as a whole. Of particular note, inflation-adjusted median household incomes for black households declined more than 12 percent from peak to trough, substantially more in percentage terms than for white, Hispanic, or Asian households (figure A).1
Median household income, by race and ethnicity
Race refers to the race of the head of household. The Hispanic and Latino ethnicity and race categories are not mutually exclusive. Some individuals, for example, are both Hispanic and white, and they are represented in both lines.
Source: Department of Commerce, Bureau of the Census (2016), Income and Poverty in the United States: 2015, Table A-1: Households by Total Money Income, Race, and Hispanic Origin of Householder: 1967 to 2015 (Washington: Census Bureau, September), www.census.gov/library/publications/2016/demo/p60-256.html.
...but considerable progress has been made
In the eight years since the crisis, the U.S. economy has made considerable progress across a broad range of measures; this progress has occurred while the resilience of the financial system has been shored up. More than 15 million jobs have been created, on net, since the fall of 2009, and the unemployment rate has fallen by half. In addition, the LFPR has moved roughly sideways since 2014, which should be viewed as a cyclical improvement given the demographic changes and other secular trends that have put downward pressure on participation for the past 10 years. The robust job gains seen during the current expansion are all the more noteworthy given these demographic pressures.
The labor market at present is likely close to being at full employment. The unemployment rate is near the median of Federal Open Market Committee (FOMC) participants’ assessments of its longer-run normal value. In addition, real GDP now stands 11 percent above its pre-recession peak, and it is approaching, though still a bit below, the Congressional Budget Office’s estimate of potential output--that is, the maximum sustainable level of economic output.2
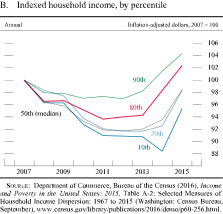
Incomes for the median family have mostly recovered from the Great Recession. Of note, real median income is reported to have risen 5.2 percent in 2015 (figure B).
Indexed household income, by percentile
Source: Department of Commerce, Bureau of the Census (2016), Income and Poverty in the United States: 2015, Table A-2: Selected Measures of Household Income Dispersion: 1967 to 2015 (Washington: Census Bureau, September), www.census.gov/library/publications/2016/demo/p60-256.html.
The recovery compares favorably with those of other advanced economies. GDP has increased faster and unemployment has declined more quickly in the United States than in other major advanced economies (figures C and D). And the Federal Reserve’s challenges in getting inflation back up to target are similar to, but not as severe as, those faced by some other major monetary authorities in the past few years. Although consumer price inflation, as measured by the price index for personal consumption expenditures, has run below the FOMC’s 2 percent objective through most of the expansion, in recent months inflation has moved closer to the Committee’s target (text figure 7).
Real gross domestic product in international context
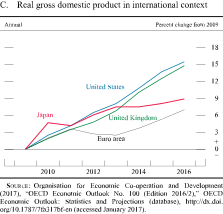
Source: Organisation for Economic Co-operation and Development (2017), "OECD Economic Outlook No. 100 (Edition 2016/2)," OECD Economic Outlook: Statistics and Projections (database), http://dx.doi.org/10.1787/7fa317bf-en (accessed January 2017).
Unemployment rate in international context
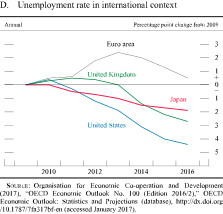
Source: Organisation for Economic Co-operation and Development (2017), "OECD Economic Outlook No. 100 (Edition 2016/2)," OECD Economic Outlook: Statistics and Projections (database), http://dx.doi.org/10.1787/7fa317bf-en (accessed January 2017).
Nonetheless, challenges remain
While much progress has been made, important challenges remain for the U.S. economy. GDP growth has averaged only about 2 percent per year during this expansion, the slowest pace of any postwar recovery (figure E). In part, that subdued pace is due to slower growth in the labor force in recent decades compared with much of the postwar period.3
Real gross domestic product in historical context
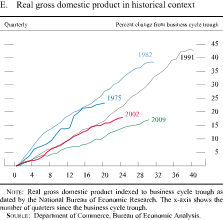
Real gross domestic product indexed to business cycle trough as dated by the National Bureau of Economic Research. The x-axis shows the number of quarters since the business cycle trough.
Source: Department of Commerce, Bureau of Economic Analysis.
Another source of slow GDP growth has been lackluster labor productivity growth (text figure 6). Since 2008, output per hour in the business sector has risen about 1 percent per year, far below the pace that prevailed before the recession. Cyclical factors, like weak business investment and firms rebuilding workforces after cutting unusually deeply during the crisis, likely explain some of the slow rise in productivity during this expansion. But structural factors may also be at play, such as declines in innovation, reduced business dynamism, or decreased product market competition.4 The productivity slowdown has taken place in most advanced economies, which suggests a role for structural factors not specific to the United States.
Meanwhile, despite the notable pickup in 2015, real incomes for the median family are still a bit lower than they were prior to the recession. Moreover, the gains have not been uniformly distributed; families at the 10th percentile of the income distribution earned about 4 percent less in 2015 than they did in 2007, while families at the 90th percentile earned about 4 percent more than before the Great Recession (figure B).
Similarly, the economic circumstances of blacks and Hispanics have improved since the depths of the recession, but they remain worse, on average, than those of whites or Asians. Unemployment rates for blacks and Hispanics continue to be well above those for their white and Asian counterparts (text figure 4), while incomes for these groups have stayed noticeably lower (figure A).
These challenges lie substantially beyond the reach of monetary policy to address. Monetary policy cannot, for instance, generate technological breakthroughs or address the root causes of inequality.
...and is close to full employment
Other indicators are also consistent with a healthy labor market. Layoffs as a share of private employment, as measured in the Job Openings and Labor Turnover Survey (JOLTS), remained at a low level through December, and recent readings on initial claims for unemployment insurance, a more timely measure, point to a very low pace of involuntary separations. The JOLTS quits rate has generally continued to trend up and is now close to pre-crisis levels, indicating that workers feel increasingly confident about their employment opportunities. In addition, the rate of job openings as a share of private employment has remained near record-high levels. The share of workers who are employed part time but would like to work full time--which is part of the U-6 measure of underutilization from the Bureau of Labor Statistics (BLS)--is still somewhat elevated, however, even though it has declined further; as a result, the gap between U-6 and the headline unemployment rate is somewhat wider than it was in the years before the Great Recession (figure 3).
Measures of labor underutilization
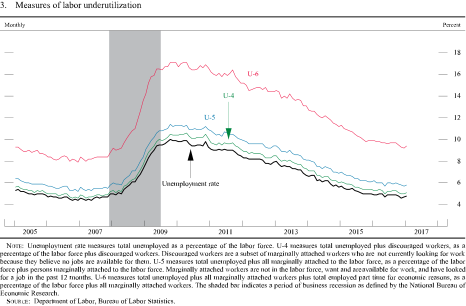
Unemployment rate measures total unemployed as a percentage of the labor force. U-4 measures total unemployed plus discouraged workers, as a percentage of the labor force plus discouraged workers. Discouraged workers are a subset of marginally attached workers who are not currently looking for work because they believe no jobs are available for them. U-5 measures total unemployed plus all marginally attached to the labor force, as a percentage of the labor force plus persons marginally attached to the labor force. Marginally attached workers are not in the labor force, want and are available for work, and have looked for a job in the past 12 months. U-6 measures total unemployed plus all marginally attached workers plus total employed part time for economic reasons, as a percentage of the labor force plus all marginally attached workers. The shaded bar indicates a period of business recession as defined by the National Bureau of Economic Research: December 2007-June 2009.
Source: Department of Labor, Bureau of Labor Statistics.
The jobless rate for African Americans also continued to edge lower in the second half of 2016, while the rate for Hispanics remained flat; as with the overall unemployment rate, these rates are near levels seen leading into the recession. Despite these gains, the average unemployment rates for these groups of Americans have remained high relative to the aggregate, and those gaps have not narrowed over the past decade (figure 4).
Unemployment rate by race and ethnicity
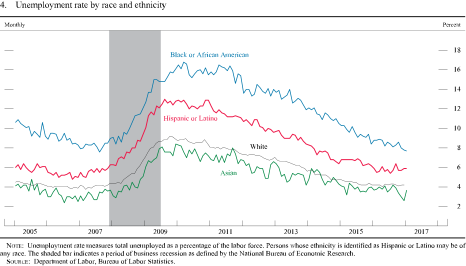
Unemployment rate measures total unemployed as a percentage of the labor force. Persons whose ethnicity is identified as Hispanic or Latino may be of any race. The shaded bar indicates a period of business recession as defined by the National Bureau of Economic Research: December 2007-June 2009.
Source: Department of Labor, Bureau of Labor Statistics.
Labor compensation growth is picking up...
The improving labor market appears to be contributing to somewhat larger gains in labor compensation. Major BLS measures of hourly compensation posted larger increases last year. Of these, the measures that include the costs of benefits have posted smaller gains than wage-only measures because of a slowdown in the growth of employer health-care costs. A compensation measure computed by the Federal Reserve Bank of Atlanta, which tracks only the wages of workers who were employed at two points in time spaced 12 months apart, shows even more pickup than these BLS measures (figure 5).
Measures of change in hourly compensation
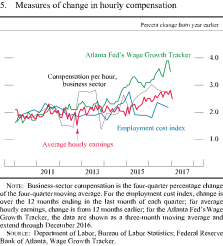
For average hourly earnings, change is from 12 months earlier; for the Atlanta Fed's Wage Growth Tracker, the data are shown as a three-month moving average and extend through December 2016.
Source: Department of Labor, Bureau of Labor Statistics; Federal Reserve Bank of Atlanta, Wage Growth Tracker.
...amid persistently slow productivity growth
As in the previous several years, gains in labor compensation last year occurred against a backdrop of persistently slow productivity growth. Since 2008, labor productivity gains have averaged around 1 percent per year, well below the pace that prevailed from the mid-1990s to 2007 and somewhat below the 1974–95 average of 1 1/2 percent per year (figure 6). Since 2011, output per hour has averaged only a little more than 1/2 percent per year. The relatively slow pace of productivity growth in recent years is in part a consequence of the slower pace of capital accumulation; diminishing gains in technological innovations and downward trends in business formation also may have played a role.
Change in business-sector output per hour
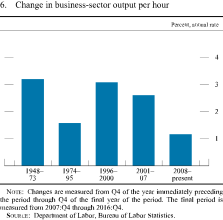
Changes are measured from Q4 of the year immediately preceding the period through Q4 of the final year of the period. The final period is measured from 2007:Q4 through 2016:Q4.
Source: Department of Labor, Bureau of Labor Statistics.
Price inflation has picked up over the past year...
In recent years inflation has been persistently low, in part because the drop in oil prices and the rise in the exchange value of the dollar since mid-2014 have led to sharp declines in energy prices and relatively weak non-energy import prices. The effects of these earlier developments have been waning, however, and overall inflation has been moving up toward the FOMC’s 2 percent target; the 12-month change in overall PCE prices reached 1.6 percent in December, compared with only 0.6 percent over 2015. The PCE price index excluding food and energy items, which provides a better indication than the headline figure of where overall inflation will be in the future, rose 1.7 percent over the 12 months ending in December, somewhat greater than the 1.4 percent increase in the prior year, as prices for a wide range of core goods and services accelerated. Nonetheless, the rate of inflation for both total and core PCE prices remains below the Committee’s target (figure 7).
Change in the price index for personal consumption expenditures
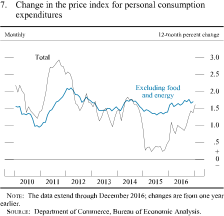
The data extend through December 2016; changes are from one year earlier.
Source: Department of Commerce, Bureau of Economic Analysis.
...as oil and other commodity prices moved up moderately
The similar readings for headline and core PCE inflation last year partly reflect an upturn in crude oil in 2016 following the sharp decline in the prior two years. Since July, oil prices traded mostly in the $45 to $50 per barrel range until the November OPEC agreement regarding production cuts in 2017 (figure 8). In the wake of that agreement, prices moved up to about $55, roughly $15 per barrel higher since late 2015. Retail gasoline prices also rose after the November OPEC agreement, but that increase has partially reversed in recent weeks.
After falling during 2014 and 2015, non-oil import prices stabilized in late 2016, supported by the rise in nonfuel commodity prices as well as by an uptick in foreign inflation (figure 9). In particular, prices of metals have increased in the past few months, boosted by production cuts combined with improved prospects for demand both in the United States and abroad. However, factors holding non-oil import prices down include dollar appreciation in the second half of 2016 and lower prices of agricultural goods last fall, as U.S. harvests hit record-high levels for many crops.
Brent spot and futures prices
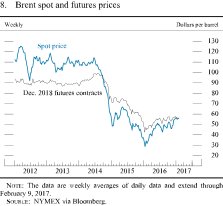
The data are weekly averages of daily data and extend through February 9, 2017.
Source: NYMEX via Bloomberg.
Series: Spot price and December 2018 futures contracts Horizon: January 5, 2012, to February 9, 2017 Description: The data are weekly averages of daily data and are plotted as two curves. Units for both the spot price and the futures contracts are in dollars per barrel along the right axis. In the early part of 2012, there is a notable increase and then a sharp decrease in the spot price. Both series remain fairly constant from late 2012 until mid-2014, when both series decrease sharply. Spot and futures prices are little changed, on net, over the first half of 2015 but then decline over the second half. Both series begin to increase in early 2016. In late 2016 and early 2017, the spot price increases while the futures prices begin to level off. As a result, the gap between futures contracts and the spot price narrows until the series are nearly identical in February 2017. The spot price starts at just above 110 at the beginning of 2012 and then increases fairly rapidly through the first quarter before peaking at around 125. The price then falls dramatically to around 90 before recovering to around 110 through the middle of 2012. The price then fluctuates around 110 through the first half of 2014, with the most dramatic change being a fall from around 120 to around 100 in the beginning of 2013. In the second half of 2014, the series declines dramatically from above 110 to below 50. In the first quarter of 2015, the series increases steeply to 60 before making a slight drop to near 55. In the second quarter of 2015, the series increases to above 65, then declines to about 45 in the middle of the third quarter. From the beginning of the fourth quarter to the beginning of the first quarter of 2016, the series declines from about 50 to just under 30. The series gradually increases over 2016 and the start of 2017 to about 55 by the beginning of February, where the series ends. The December 2018 future contracts series starts just above 90 in 2012 and is relatively unchanged with little volatility until the middle of 2014, when the series gradually increases to just under 100. Starting in the third quarter of 2014 until January 2015, the series drops dramatically to about 70. It then stays around 70 before a steeper decline to about 60 occurs in the third quarter. The series remains around 60 in the beginning of the fourth quarter but then declines to just below 45 between the middle of the fourth quarter and the beginning of the first quarter of 2016. The series then gradually increases over the first half of 2016 to about 55 by the middle of June. The series then fluctuates between 50 and 60 for the period from the middle of June until early February, when the series ends.
Non-oil import prices and U.S. dollar exchange rate
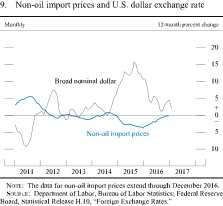
The data for non-oil import prices extend through December 2016.
Source: Department of Labor, Bureau of Labor Statistics; Federal Reserve Board, Statistical Release H.10, "Foreign Exchange Rates."
Survey measures of longer-term inflation expectations have been generally stable...
Wage- and price-setting decisions are likely influenced by expectations for inflation. Surveys of professional forecasters outside the Federal Reserve System indicate that their longer-term inflation expectations have remained stable and consistent with the FOMC’s 2 percent objective for PCE inflation. In contrast, the median inflation expectation over the next 5 to 10 years as reported by the University of Michigan Surveys of Consumers has generally trended downward over the past few years, though it is little changed from a year ago; this measure was at 2.5 percent in early February (figure 10). It is unclear how best to interpret that downtrend; this measure of inflation expectations has been above actual inflation for much of the past 20 years.
Median inflation expectations
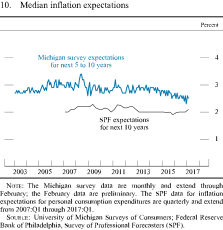
The Michigan survey data are monthly and extend through February; the February data are preliminary.
Source: University of Michigan Surveys of Consumers.
...and market-based measures of inflation compensation have moved up notably in recent months but also remain relatively low
TIPS-based inflation compensation (5 to 10 years forward), after declining to very low levels through the middle of 2016, has risen to nearly 2 percent and is about 20 basis points higher than it was at the end of 2015. However, this level is still below the 2 1/2 to 3 percent range that persisted for most of the 10 years prior to 2014 (figure 11).
5-to-10-year-forward inflation compensation
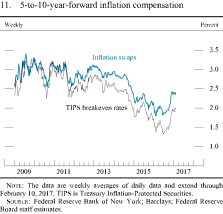
The data are weekly averages of daily data and extend through February 10, 2017. TIPS is Treasury Inflation-Protected Securities.
Source: Federal Reserve Bank of New York; Barclays; Federal Reserve Board staff estimates.
Series: Inflation swaps and TIPS breakeven 5-to-10-year-forward inflation compensation Horizon: January 2009 to February 2017 Description: Weekly data are plotted as two curves. Units for both series are percent and are along the right axis. Broadly speaking, the two curves tend to run parallel, with the inflation swaps series running a little higher than the TIPS breakeven series after 2011. The two series are largely indistinguishable between 2009 and 2011. The inflation swaps series starts in January 2009 at approximately 2.75 percent, spiking to approximately 3.5 in mid-2009, declining to approximately 2.5 in mid-2010, and spiking again to approximately 3 in mid-2011. The series continues to fluctuate between about 2.5 and 3.1 from late 2011 through mid-2014. The series then sharply declines over the latter half of 2014, briefly rises in mid-2015, and then declines, on average, through mid-2016 to a low of approximately 1.75. The series then begins to climb over the second half of 2016 to end at almost 2.5 on February 10, 2017. The TIPS breakeven series starts at approximately 2.3 percent for the first week of January 2009, spiking to approximately 2.75 later that month, and subsequently follows a path similar to the inflation swaps series. The series continues to fluctuate between about 2.25 and 3.25 from early 2009 through mid-2014. The series then sharply declines over the latter half of 2014 and increases modestly in the second quarter of 2015. The series stays below 2 for the rest of 2015 and 2016, and then mostly climbs in late 2016 to end at almost 2.0 on February 10, 2017.
Real GDP growth picked up in the second half of 2016
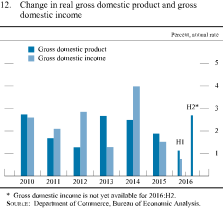
Real GDP is reported to have increased at an annual rate of 2 3/4 percent in the second half of 2016 after increasing just 1 percent in the first half (figure 12). Much of the step-up reflects the stabilization of inventory investment, which held down GDP growth considerably in the first half of last year, as well as a pickup in government purchases of goods and services. Private domestic final purchases--that is, final purchases by U.S. households and businesses--grew more steadily than GDP last year and posted a fairly solid gain in the second half. PCE growth was bolstered by rising incomes and wealth, while private fixed investment was weak despite the low costs of borrowing for many households and businesses. Although the FOMC has increased the federal funds rate twice as this expansion has progressed--once in December 2015 and again in December 2016--in 1/4 percentage point steps, overall financial conditions have been sufficiently accommodative to support somewhat-faster-than-trend growth in real activity.
Change in real gross domestic product and gross domestic income
Source: Department of Commerce, Bureau of Economic Analysis.
Gains in income and wealth have continued to support consumer spending...
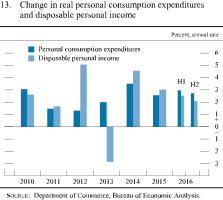
Real consumer spending rose at an annual rate of 2 3/4 percent in the second half of 2016, a solid pace similar to the one seen in the first half. Consumption has been supported by the ongoing improvement in the labor market and the associated increases in real disposable personal income (DPI)--that is, income after taxes and adjusted for price changes. Real DPI increased 2¼ percent in 2016 following a gain of 3 percent in 2015, when purchasing power was boosted by falling energy prices (figure 13).
Change in real personal consumption expenditures and disposable personal income
Source: Department of Commerce, Bureau of Economic Analysis.
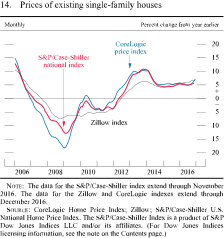
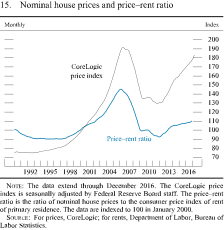
Consumer spending has also been supported by further increases in household net worth. Broad measures of U.S. equity prices rose solidly over the past year, and house prices continued to move up (figure 14). (In nominal terms, national house prices are approaching their peaks of the mid-2000s, though relative to rents or income, house price valuations are much lower than a decade ago (figure 15).) Buoyed by these cumulative increases in home and equity prices, aggregate household net worth has risen appreciably from its level during the recession, and the ratio of household net worth to income remains well above its historical average (figure 16). The benefits of homeownership have not been distributed evenly; see the box “Homeownership by Race and Ethnicity.”
Prices of existing single-family houses
The data for the S&P/Case-Shiller index extend through November 2016. The data for the Zillow and CoreLogic indexes extend through December 2016.
Source: CoreLogic Home Price Index; Zillow; S&P/Case-Shiller U.S. National Home Price Index. The S&P/Case-Shiller Index is a product of S&P Dow Jones Indices LLC and/or its affiliates. (For Dow Jones Indices licensing information, see the note on the Contents page: For figures 14, 33, and 37, note that the S&P 500 Index and the Dow Jones Bank Index are products of S&P Dow Jones Indices LLC and/or its affiliates and have been licensed for use by the Board. Copyright © 2017 S&P Dow Jones Indices LLC, a subsidiary of the McGraw Hill Financial Inc., and/or its affiliates. All rights reserved. Redistribution, reproduction, and/or photocopying in whole or in part are prohibited without written permission of S&P Dow Jones Indices LLC. For more information on any of S&P Dow Jones Indices LLC's indices please visit www.spdji.com. S&P® is a registered trademark of Standard & Poor's Financial Services LLC, and Dow Jones® is a registered trademark of Dow Jones Trademark Holdings LLC. Neither S&P Dow Jones Indices LLC, Dow Jones Trademark Holdings LLC, their affiliates nor their third party licensors make any representation or warranty, express or implied, as to the ability of any index to accurately represent the asset class or market sector that it purports to represent, and neither S&P Dow Jones Indices LLC, Dow Jones Trademark Holdings LLC, their affiliates nor their third party licensors shall have any liability for any errors, omissions, or interruptions of any index or the data included therein.)
Nominal house prices and price-rent ratio
The data extend through December 2016. The CoreLogic price index is seasonally adjusted by Federal Reserve Board staff. The price--rent ratio is the ratio of nominal house prices to the consumer price index of rent of primary residence. The data are indexed to 100 in January 2000.
Source: For prices, CoreLogic; for rents, Department of Labor, Bureau of Labor Statistics.
Wealth-to-income ratio
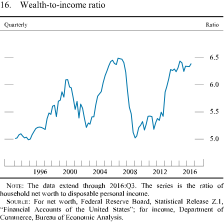
The data extend through 2016:Q3. The series is the ratio of household net worth to disposable personal income.
Source: For net worth, Federal Reserve Board, Statistical Release Z.1, "Financial Accounts of the United States"; for income, Department of Commerce, Bureau of Economic Analysis.
Homeownership by Race and Ethnicity
Most households in the United States own their homes, and among those who do not, many continue to aspire to own their homes.1 The popularity of homeownership may stem from the amenities and financial benefits that are associated with ownership. For example, on the financial side, owning a home protects households against volatility in rental prices and may help them build wealth as they repay their mortgage.2 Historically, we have seen disparities in homeownership across racial and ethnic groups, and these disparities are an important dimension of racial inequality in the United States.3
Nationally representative data from 1900 through 2015 indicate that the overall homeownership rate rose sharply from 1940 to 1960 (figure A).4 Research suggests that this surge in homeownership reflected a combination of factors, including the postwar economic boom and an easing of terms for mortgage credit (such as reduced down payment requirements and longer terms to maturity) through government-backed lending programs run by the Federal Housing Administration and the Veterans Administration.5 The homeownership rate then edged up slightly further, on net, between 1960 and 2006. However, since the onset of the housing crash and the financial crisis in 2007, the homeownership rate has declined as foreclosures became elevated for several years and first-time homebuying dropped and remained subdued.6
Homeownership rates, by race and ethnicity
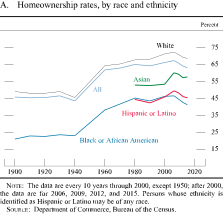
The data are every 10 years through 2000, except 1950; after 2000, the data are for 2006, 2009, 2012, and 2015. Persons whose ethnicity is identified as Hispanic or Latino may be of any race.
Source: Department of Commerce, Bureau of the Census.
These post-crisis declines in homeownership have been similar for white, black, and Hispanic households and somewhat smaller for Asian households.7 Thus, the large gaps between the homeownership rates of white households and those of black and Hispanic households have held steady, while the smaller gap between white and Asian households has narrowed slightly. Perhaps the most striking feature of the data is the persistence of the black–white homeownership gap, which has measured about 25 to 30 percentage points throughout the past 115 years. Potential reasons for this persistence will be discussed shortly.
The likelihood of owning one’s home rises with age. Thus, the aging of the U.S. population contributed to increasing homeownership before 2006 and would have caused the homeownership rate to continue rising after 2006, all else being equal. Examining the data separately by age group reveals homeownership trends that differ from overall averages, with stronger declines in homeownership observed for young and middle-aged households. For example, among households headed by a person 30 to 39 years old, homeownership rates fell more than 10 percentage points between 2006 and 2015 for all major races and ethnicities (figure B).8 For both white and black households in this age range, the homeownership rate peaked in 1980, much earlier than the overall national average; by 2015, it stood well below its level in 1960. Over the past century, the black–white homeownership gap has actually widened for households in this age range.
Homeownership rates, by race and ethnicity, for households headed by persons aged 30 to 39
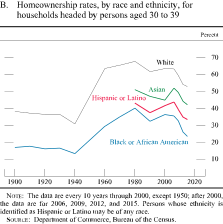
The data are every 10 years through 2000, except 1950; after 2000, the data are for 2006, 2009, 2012, and 2015. Persons whose ethnicity is identified as Hispanic or Latino may be of any race.
Source: Department of Commerce, Bureau of the Census.
In light of the gains in education, income, and access to credit and housing over the long term for minorities in the United States, the persistence of the black–white gap is surprising. A considerable amount of academic research has sought to better understand differences in homeownership rates across racial and ethnic groups.9 Many factors have been found to influence the likelihood of homeownership, and some of these may have had offsetting effects on the black–white gap. For example, from 1940 to 1960, the migration of many black families from the South to northern central cities (where owning a home was less likely regardless of race) tended to offset the positive effects on the homeownership rate from gains in income and education.10
In more recent decades, the relative rise in the fraction of black households headed by a single parent may have offset factors that otherwise would have generated increases in homeownership rates, including the introduction and enforcement of anti-discrimination laws, such as the Equal Credit Opportunity Act and the Fair Housing Act. Research on the black–white and Hispanic–white gaps indicates that a large portion of these gaps in recent years can be attributed to socioeconomic differences--such as age, income, and family structure--across groups.11 That said, some of the overall gap is not explainable on the basis of those variables and could reflect other factors such as location and housing preferences; it also could reflect continued discrimination in housing and credit markets.12 Finally, recent research has also documented larger differences in credit scores between whites and minorities than can be explained by income disparities; thus, the tighter mortgage credit environment that prevails today relative to a dozen or more years ago could cause the homeownership gap to widen in the near term.13
...as does credit availability
Consumer credit has continued to expand somewhat faster than income amid stable delinquencies on consumer debt (figure 17). Auto and student loans remain widely available even to borrowers with lower credit scores, and outstanding balances on these types of loans continued to expand at a robust pace. Credit card balances continued to grow and were 6 percent higher than one year earlier in December. That said, credit card standards have remained tight for nonprime borrowers. As a result, delinquencies on credit cards are still near low historical levels.
Changes in household debt
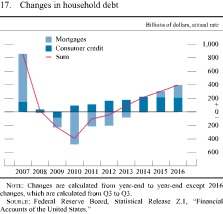
Changes are calculated from year-end to year-end except 2016 changes, which are calculated from Q3 to Q3.
Source: Federal Reserve Board, Statistical Release Z.1, "Financial Accounts of the United States."
Consumer confidence is strong
Household spending has also been supported by favorable consumer sentiment. In 2015 and through most of 2016, readings from the overall index of consumer sentiment from the Michigan survey were solid, likely reflecting rising incomes and job gains. Sentiment has improved further in the past couple of months (figure 18). The share of households expecting real income gains over the next year or two is now close to its pre-recession level despite having lagged improvements in the headline sentiment measure earlier in the recovery.
Indexes of consumer sentiment and income expectations
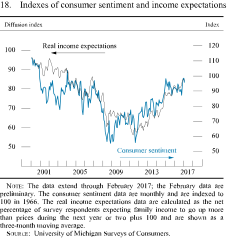
The data extend through February 2017; the February data are preliminary. The consumer sentiment data are monthly and are indexed to 100 in 1966. The real income expectations data are calculated as the net percentage of survey respondents expecting family income to go up more than prices during the next year or two plus 100 and are shown as a three-month moving average.
Source: University of Michigan Surveys of Consumers.
Housing construction has been sluggish despite rising home demand
Residential investment spending appears to have only edged higher in 2016 following a larger gain in the previous year. Single-family housing starts registered a moderate increase in 2016, while multifamily housing starts flattened out on balance (figures 19). The pace of construction activity in 2016 remained sluggish despite solid gains in house prices and ongoing improvements in demand for both new and existing homes (figure 20). As a result, the months’ supply of inventories of homes for sale dropped to low levels, and the aggregate vacancy rate moved to its lowest level since 2005. Reportedly, tight supplies of skilled labor and developed lots have been restraining home construction.
Private housing starts and permits
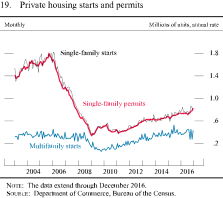
The data extend through December 2016.
Source: Department of Commerce, Bureau of the Census.
New and existing home sales
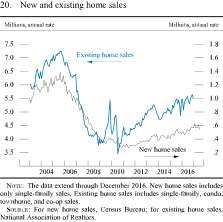
The data extend through December 2016. New home sales includes only single-family sales. Existing home sales includes single-family, condo, townhome, and co-op sales.
Source: For new home sales, Census Bureau; for existing home sales, National Association of Realtors.
Homebuying and residential construction have been supported by low interest rates and ongoing easing of credit standards for mortgages. Banks indicated in the October 2016 Senior Loan Officer Opinion Survey on Bank Lending Practices (SLOOS) that they eased standards on several categories of residential home purchase loans.1 Even so, mortgage credit is still relatively difficult to access for borrowers with low credit scores, harder-to-document income, or high debt-to-income ratios. Although mortgage rates moved up from their all-time low levels over the second half of last year, they remain quite low by historical standards, and, consequently, housing affordability remains favorable (figure 21).
Mortgage rates and housing affordability
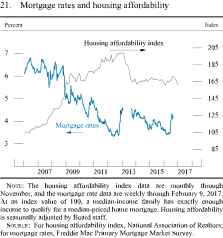
The mortgage rate data are weekly through February 9, 2017.
Source: Freddie Mac Primary Mortgage Market Survey.
Business investment may be turning up after a period of surprising weakness
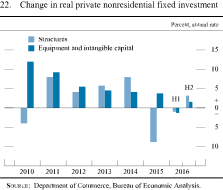
Real outlays for business investment--that is, private nonresidential fixed investment--were generally weak in 2016 but posted larger gains toward the end of the year (figure 22). Last year’s weakness occurred despite moderate increases in aggregate demand and generally favorable financing conditions, and it was widespread across categories of equipment investment. Investment in equipment and intangibles moved down over most of the year, likely reflecting the effects of the combination of low oil prices, weak export demand, and a muted longer-run demand outlook among businesses. Although such declines are unusual outside of a recession, spending on these items did turn up in the fourth quarter. Investment in drilling and mining structures, which had been falling sharply since the drop in oil prices in 2014, fell further through most of 2016 but seems to be bottoming out. Outside of the energy sector, investment in nonresidential structures increased moderately in 2016. Finally, after having been subdued for much of 2016, a widespread set of business sentiment indicators improved notably near the end of last year.
Change in real private nonresidential fixed investment
Source: Department of Commerce, Bureau of Economic Analysis.
Financing conditions for nonfinancial firms have generally remained favorable
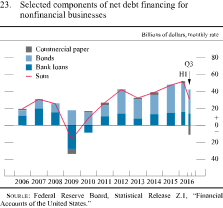
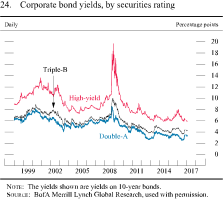
Nonfinancial businesses have continued to raise funds through bond issuance and bank loans, albeit at a somewhat slower pace than in the first half of 2016 (figure 23). The pace of such borrowing was supported in part by continued low interest rates: Corporate bond yields for speculative-grade borrowers have declined since last June, and those for investment-grade borrowers have increased but a fair bit less than those on comparable-maturity Treasury securities (figure 24). Banks indicated in the October 2016 and January 2017 SLOOS that they eased lending terms on commercial and industrial loans in the second half of the year, but that standards on such loans remained unchanged relative to earlier in 2016; banks continued to tighten standards on commercial real estate loans over the second half of last year.
Selected components of net debt financing for nonfinancial businesses
Source: Federal Reserve Board, Statistical Release Z.1, "Financial Accounts of the United States."
Corporate bond yields, by securities rating
The yields shown are yields on 10-year bonds.
Source: BofA Merrill Lynch Global Research, used with permission.
Series: High-yield, triple-B, and double-A Horizon: January 1998 to February 2017 Description: Daily data are plotted as three curves. Units are percentage points along the right axis. The behavior of all three curves follows a similar pattern. The high-yield series starts at the beginning of 1998 at just above 9. The series increases generally to about 13.5 by the end of 2000. The series then decreases, bottoming out around 7.3 in early 2004. It fluctuates in small increments around 8 before beginning to increase in mid-2007. At the beginning of 2008:Q4, the series jumps quickly, and it nearly reaches 20 in 2009. It then declines quickly to around 14, experiences another jump to about 17 in 2009:Q1, and then continues to decline generally, landing near 7 in early 2012. After increasing slightly to around 7.7 in mid-2012, the series resumes its fall, reaching below 6 in 2013:Q2. The series increases to slightly below 7 through 2014:Q4 before falling again in early 2015. The series rises starting in mid-2015 and climbs above 8 in early 2016 before falling for the remainder of 2016 and early 2017, reaching just below 6 by February 9, 2017. The triple-B series starts at the beginning of 1998 at about 6.5. The series fluctuates between about 6 and 9 until mid-2003, when it decreases generally to around 5. It gradually climbs back up to 7 by mid-2008 and then increases quickly, reaching near 10 later in that year. The series sharply declines throughout 2009, reaching about 6 by the end of the year; it then continues to decline more gradually, dipping below 4 near the end of 2012 and again in 2013:Q1. The series increases, reaching about 5 by mid-2013 before falling below 4 in early 2015 and then rising to almost 4.75 in early 2016. The series declines in 2016 and remains mostly below 4 until late 2016. The series increases at the end of 2016 and early 2017, reaching about 4.25 by February 9, 2017. The double-A series starts at the beginning of 1998 at about 6.25. The series declines generally to about 5.5 in 1998:Q4 before increasing generally to about 8 in 2000:Q2. The series then decreases generally to just above 4 by mid-2003. It remains between about 5 and 6 through the beginning of 2008. Then it increases quickly, reaching about 8.5 by 2008:Q4. The series sharply declines in late 2008 and early 2009, and then continues to fall more gradually until it reaches about 2.5 by the end of 2012. The series increases through the beginning of 2013 to around 4 but then falls through early 2015 to just under 3. It then rises to about 3.75 by mid-2015 before falling below 3 for most of 2016. The series then increases in late 2016, reaching about 3.25 by February 9, 2017.
Net exports held down second-half real GDP growth
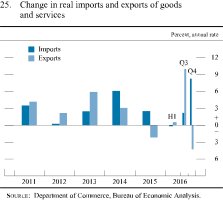
The rise in the dollar since mid-2014 and subdued foreign economic growth have continued to weigh on U.S. exports (figure 25). Nevertheless, exports increased at a moderate pace in the second half of 2016, but with much of the increase a result of rising agricultural exports. In particular, soybean exports surged in the third quarter before falling back toward a more normal level in the fourth quarter. Consistent with the stronger exchange value of the dollar, imports jumped in the second half of the year after having been about flat in the first half, when investment demand for imported equipment was very weak. Overall, real net exports were a moderate drag on real GDP growth in the second half of 2016. Although the trade balance and current account deficit narrowed slightly in the second and third quarters of 2016, the trade balance widened in the fourth quarter, as imports significantly outpaced exports (figure 26).
Change in real imports and exports of goods and services
Source: Department of Commerce, Bureau of Economic Analysis.
U.S. trade and current account balances
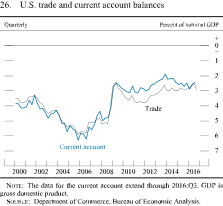
The data for the current account extend through 2016:Q3. GDP is gross domestic product.
Source: Department of Commerce, Bureau of Economic Analysis.
Federal fiscal policy was a roughly neutral influence on GDP growth in 2016...
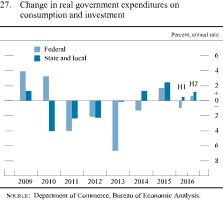
After being a drag on aggregate demand during much of the expansion, discretionary changes in federal fiscal policy have had a more neutral influence over the past two years. During 2016, policy actions had little effect on taxes and transfers, and federal purchases of goods and services are little changed over this period (figure 27). The federal budget deficit increased in fiscal year 2016 to 3.2 percent of GDP from 2.4 percent in fiscal 2015. Revenues rose only 1 percent last year in nominal terms and fell as a share of GDP because of soft personal income tax revenues and a decline in corporate income tax collections. Outlays rose 5 percent, edging up as a share of GDP, owing to increases in mandatory spending and interest payments as well as a shift in the timing of some payments that ordinarily would have been made in fiscal 2017 (figure 28). The Congressional Budget Office forecasts the deficit to be about the same size (as a share of GDP) in fiscal 2017 and in the next couple of years before rising thereafter. Consequently, the ratio of debt held by the public to nominal GDP is projected to remain near its current level of 77 percent of GDP for the next couple of years and then begin to rise (figure 29).
Change in real government expenditures on consumption and investment
Source: Department of Commerce, Bureau of Economic Analysis.
Federal receipts and expenditures
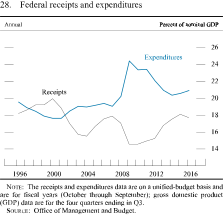
The receipts and expenditures data are on a unified-budget basis and are for fiscal years (October through September); gross domestic product (GDP) data are for the four quarters ending in Q3.
Source: Office of Management and Budget.
Federal government debt held by the public
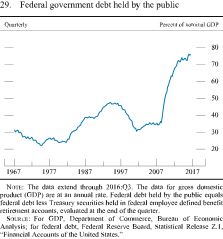
The data extend through 2016:Q3. The data for gross domestic product (GDP) are at an annual rate. Federal debt held by the public equals federal debt less Treasury securities held in federal employee defined benefit retirement accounts, evaluated at the end of the quarter.
Source: For GDP, Department of Commerce, Bureau of Economic Analysis; for federal debt, Federal Reserve Board, Statistical Release Z.1, "Financial Accounts of the United States."
...and real purchases at the state and local level continue to increase, albeit at a tepid pace
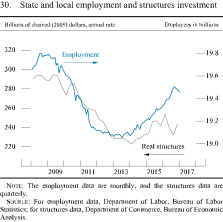
The fiscal conditions of most state and local governments have continued to improve, though the pace of improvement has been slower in recent quarters than it had been previously. The ongoing improvement facilitated a step-up in the average pace of employment gain in the sector to the strongest rate since 2008. At the same time, however, real investment in structures by state and local governments has declined, on net, since the first quarter of 2016 after trending up during the prior two years (figure 30). All told, total real state and local purchases rose anemically in 2016. On the other side of the ledger, revenue growth was subdued overall, with little growth in tax collections at the state level but moderate gains at the local level.
State and local employment and structures investment
The structures data are quarterly.
Source: Department of Commerce, Bureau of Economic Analysis.
Financial Developments
The expected path for the federal funds rate over the next several years steepened
Against the backdrop of continued strengthening in the labor market and an increase in inflation over the course of 2016, the path of the federal funds rate implied by market quotes on interest rate derivatives has moved up, on net, since the middle of last year. Following the U.S. elections in November, the expected policy path in the United States steepened significantly, apparently reflecting investors’ expectations of a more expansionary fiscal policy. Meanwhile, market-based measures of uncertainty about the policy rate approximately one to two years ahead also increased, on balance, suggesting that some of the firming in market rates may reflect a rise in term premiums.
Survey-based measures of the expected path of policy also moved up in recent months. In the Survey of Primary Dealers that was conducted by the Federal Reserve Bank of New York just prior to the January 2017 FOMC meeting, the median dealer expected two rate hikes in 2017 and three rate hikes in 2018 as the most likely outcome.2
U.S. nominal Treasury yields increased considerably
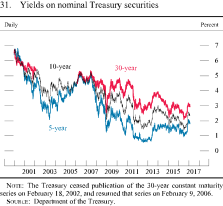
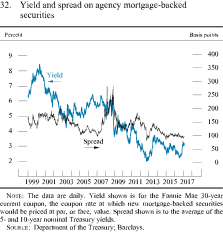
After dropping significantly during the first half of 2016 and reaching near-historical lows in the aftermath of the U.K. referendum on exit from the European Union, or Brexit, in June, yields on medium- and longer-term nominal Treasury securities rebounded strongly in the second half of last year, with a substantial rise following the U.S. elections (figure 31). Market participants have attributed the increase in yields following the elections primarily to expectations of a more expansionary fiscal policy. The boost in longer-term nominal yields in recent months reflects roughly equal increases in real yields and inflation compensation. Consistent with the changes in Treasury yields, yields on 30-year agency mortgage-backed securities (MBS)––an important determinant of mortgage interest rates––increased significantly over the second half of the year (figure 32). However, Treasury and MBS yields remain quite low by historical standards.
Yields on nominal Treasury securities
The Treasury ceased publication of the 30-year constant maturity series on February 18, 2002, and resumed that series on February 9, 2006.
Source: Department of the Treasury.
Series: 5-, 10-, and 30-year yields on nominal Treasury securities Horizon: January 2000, to February 9, 2017 Description: Daily data are plotted as three curves. Units are percent. The curves follow similar patterns and rarely intersect. The 5-year Treasury yield curve starts in 2000 at 6.5 and declines steeply to just above 2 in 2003. The series gradually increases over the next three years to roughly 5 in 2006, where it stays until dropping to about 1.5 in late 2008. The series increases in the beginning of 2009 to roughly 2.5, and it remains between 2 and 3 until declining and returning to 1 during 2010. The series rises back above 2 in early 2011 but falls again below 1 in late 2011, where it stays until mid-2013. It then increases sharply to roughly 1.5. The series generally stays between 1 and 2 until the end of 2016, when it increases sharply again to 2. The 5-year Treasury yield curve ends at around 2 in February 2017. The 10-year Treasury yield curve starts in 2000 slightly above 6.5 but does not fall as steeply as the 5-year Treasury yield curve and reaches a low of roughly 3 in 2003. The series gradually increases over the next three years to roughly 5 in 2006, once again at the same level as the 5-year Treasury yield curve. After 2007, the 10-year Treasury yield curve remains above the 5-year Treasury yield curve by roughly 1 percentage point. The curve drops below 2.5 in late 2008. The series then increases in the beginning of 2009 to nearly 4, and it remains between 3 and 4 until declining and returning to 2.5 during 2010. The series rises back above 3 in early 2011 but falls again below 2 in late 2011, where it stays until mid-2013. It then sharply increases to about 2.75. With a slight uptick in mid-2015, the series gradually declines from its 2.75 peak to a low of 1.5 at the end of 2016 before sharply increasing to about 2.5. The 10-year Treasury yield curve ends at about 2.5 in February 2017. The 30-year Treasury yield curve starts in 2000 slightly above 6.5 and gradually falls to just above 5.25 in early 2002, when the series breaks until early 2006. The series resumes at roughly 4.5 and hovers around this value until late 2008, when the series rapidly spikes down to about 2.5. The series rises back above 4 in mid-2009, where it remains until declining to 3.75 during 2010. The series rises back near 4.5 in early 2011 but falls below 3 in late 2011, where it stays until mid-2013. In mid-2013 the series sharply increases to nearly 4. The series falls gradually to about 2.25 in early 2015, reaching a level close to the 10-year Treasury yield. In mid-2015, the series rises to slightly more than 3 and gradually declines to about 2.5 at the end of 2016, when it sharply increases again to slightly more than 3. The 30-year Treasury yield curve ends at around 3 in February 2017.
Yield and spread on agency mortgage-backed securities
The data are daily. Yield shown is for the Fannie Mae 30-year current coupon, the coupon rate at which new mortgage-backed securities would be priced at par, or face, value. Spread shown is to the average of the 5- and 10-year nominal Treasury yields.
Source: Department of the Treasury; Barclays.
Series: Yield and spread on agency mortgage-backed securities Horizon: January 1999, to February 9, 2017 Description: Daily data are plotted as two curves. Units for the yield series are percent along the left axis. Units for the spread series are basis points along the right axis. The yield series starts in January 1999 around 6.25 and quickly increases to approximately 8.5 in 2000 before declining to approximately 4.25 by mid-2003. The series increases to approximately 6.25 by mid-2006 and then declines to approximately 4 by early 2009 and approximately 2 by late 2012. The series increases again to approximately 3.75 by late 2013, gradually declining to about 2.5 before slightly increasing to about 3 in mid-2015. The series declines to about 2.5 in late 2016, when it increases sharply to slightly more than 3. The series ends at around 3 in February 2017. The spread series starts in January 1999 at approximately 150, drops to 125 in mid-1999, and returns to 150 in 2000. A similar decline and rise occurs in mid-2000 before the series hovers around 150 throughout 2001. The series increases to approximately 175 by late 2002. The series declines to approximately 100 by early 2005, where it hovers for about two years, then spikes to approximately 275, where it remains throughout 2008 before declining to approximately 150 by mid-2009. The series then fluctuates between 100 and 150 from late 2009 through early 2015, with a brief decline below 100 in late 2012. The series flattens to roughly 100 by mid-2015 and ends at approximately 100 in February 2017.
Broad equity price indexes increased notably...
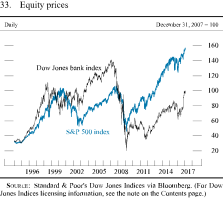
U.S. equity markets were volatile around the Brexit vote in the United Kingdom but operated without disruptions. Broad equity price indexes have increased notably since late June, with a sizable portion of the gain occurring after the U.S. elections in November (figure 33). Reportedly, equity prices have been supported in part by the perception that corporate tax rates may be reduced. Stock prices of banks, which tend to benefit from a steepening in the yield curve, outperformed the broader market. Moreover, market participants pointed to expectations of changes in the regulatory environment as a factor contributing to the outperformance of bank stocks. By contrast, stock prices of firms that tend to benefit from lower interest rates, such as utilities, declined moderately on net. The implied volatility of the S&P 500 index--the VIX--fell, ending the period close to the bottom of its historical range. (For a discussion of financial stability issues over this same period, see the box “Developments Related to Financial Stability.”)
Equity prices
Source: Standard & Poor's Dow Jones Indices via Bloomberg. (For Dow Jones Indices licensing information, see the note on the Contents page, or Figure 14.)
Series: Dow Jones bank index and S&P 500 index Horizon: January 1994, to February 9, 2017 Description: Daily data are plotted as two curves. Units for both series have been indexed to 100 based on their respective values on December 31, 2007. The Dow Jones bank index series starts in January 1994 at approximately 30. The series increases to approximately 110 in 1998, after which it fluctuates between about 70 and 100 from 1999 through 2003. The series then increases to approximately 140 in early 2007 before falling sharply to approximately 20 in early 2009. The series gradually recovers over the next several years, rising to approximately 80 in mid-2015 before dropping slightly to approximately 65 in early 2016. The series sharply increases at the end of 2016 to about 100, where it ends in February 2017. The S&P 500 index series starts in January 1994 at approximately 30. The series increases to approximately 100 in 2000 before falling to approximately 50 by the end of 2002. The series increases to approximately 100 in early 2007, then sharply falls to approximately 50 in early 2009. The series generally increases over the next several years to about 140 in 2015 before fluctuating between approximately 120 and 140 until the end of 2016, when it increases to nearly 160. The series ends just below 160 in February 2017.
Developments Related to Financial Stability
Financial vulnerabilities in the U.S. financial system overall have continued to be moderate since mid-2016. U.S. banks are well capitalized and have sizable liquidity buffers. Nonfinancial corporate business leverage has remained elevated by historical standards, and household borrowing has increased modestly, leaving the household debt-to-income ratio about unchanged. On balance, the ratio of aggregate nonfinancial credit to gross domestic product (GDP) has moved up a little in recent years to about its level in the mid-2000s but remains well below its recent peak. Valuation pressures in some asset classes have been rising, particularly late last year.
Vulnerabilities stemming from leverage in the financial sector appear low. Regulatory capital has remained at historically high levels for most large domestic banks, and all 33 firms participating in the Federal Reserve’s supervisory stress tests for 2016 were able to maintain capital ratios above required minimums through the severely adverse recession scenario.1 Moreover, market-based measures of leverage for domestic banks have decreased somewhat since November. However, valuations of many of the largest foreign banks remain depressed. Despite the settlement on December 23 between Deutsche Bank and the U.S. Department of Justice and some progress toward addressing problems in the Italian banking sector, several large European financial institutions have continued to be vulnerable to unexpected developments. Available data suggest that the leverage of nonbank financial institutions was relatively stable in the second half of 2016.
On balance, vulnerabilities associated with liquidity and maturity transformation are also somewhat below their longer-run average. The reliance of large bank holding companies on short-term funding remains subdued, and their holdings of high-quality liquid assets are robust, owing in part to the implementation of the Liquidity Coverage Ratio. Money market mutual fund (also referred to as money market fund, or MMF) reforms designed to reduce the advantages associated with being the first to exit a fund in times of financial stress led to large declines in prime MMF assets under management, with most of these funds migrating to government MMFs. While the resulting smaller size of prime funds and the new regulations should make the industry more stable, the longer-term effect will depend on the degree to which such activity migrates to other types of short-term investment vehicles that may be subject to similar fragilities.
Asset valuation pressures have increased, on balance, since mid-2016, along with several indicators of investors’ risk appetite. Although yields on Treasury securities and term premiums increased as market expectations about future growth shifted higher in the fall, they both remain low. In addition, the spread of yields on corporate bonds over those on comparable-maturity Treasury securities narrowed. Estimates of risk premiums in equity markets also declined. Outstanding riskier corporate debt edged down over the past year, but gross issuance of leveraged loans was strong and the share of bond issuance rated B or below remained in the fourth quarter at the high end of its range over the past few years. Commercial real estate (CRE) valuations, which have been an area of growing concern over the past year, rose further, with property prices continuing to climb and capitalization rates decreasing to historically low levels. While CRE debt remains modest relative to the overall size of the economy and the tightening in bank lending standards for CRE loans in the second half of last year may reflect some reduction in the appetite for CRE lending, the heightening of valuation pressures may leave some smaller banks vulnerable to a sizable CRE price decline. Also, residential home prices continued to rise briskly through November. Although most measures of residential valuation have moved up somewhat, they are still only modestly above the levels that would be predicted, given rents and investment costs. The results of the Federal Reserve’s 2017 stress tests, for which the scenarios were released on February 3, will help gauge the vulnerability of large U.S. banks to all of these asset valuation pressures.
Vulnerabilities stemming from private nonfinancial-sector borrowing remain moderate. The credit-to-GDP ratio for the corporate sector is elevated after several years of rapid growth. Despite this high leverage, interest-expense ratios are low by historical standards even among higher-risk firms, as are measures of expected default based on accounting and stock return data, especially outside of the oil sector. Turning to households, debt growth was modest through the third quarter of 2016, and the debt-to-income ratio has changed little over the past few years. Except for a recent increase in early-payment delinquencies in subprime auto loans--a small segment of overall indebtedness--broad indicators of household solvency have remained within historical norms. On balance, the private nonfinancial-sector credit-to-GDP ratio is far below the levels seen late last decade and lies near its level in the mid-2000s (figure A).
Private nonfinancial sector credit-to-GDP ratio
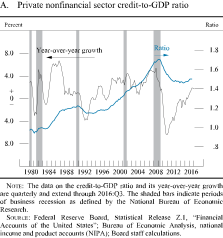
The data on the credit-to-GDP ratio and its year-over-year growth are quarterly and extend through 2016:Q3. The shaded bars indicate periods of business recession as defined by the National Bureau of Economic Research: January 1980-July 1980, July 1981-November 1982, July 1990-March 1991, March 2001-November 2001, and December 2007-June 2009.
Source: Federal Reserve Board, Statistical Release Z.1, "Financial Accounts of the United States"; Bureau of Economic Analysis, national income and product accounts (NIPA); Board staff calculations.
Last fall, the Federal Reserve Board finalized its framework for setting the Countercyclical Capital Buffer (CCyB) and later voted to maintain the CCyB at zero.2 In forming its view about the appropriate size of the U.S. CCyB, the Board intends to monitor a wide range of financial and economic indicators and consider their implications for financial system vulnerabilities, including but not limited to asset valuation pressures, risk appetite, leverage in the financial and nonfinancial sectors, and maturity and liquidity transformation in the financial sector. The decision to maintain the CCyB at zero in part reflected an assessment that vulnerabilities associated with financial-sector leverage were at the lower end of their historical ranges.
As part of its effort to improve the resilience of financial institutions and overall financial stability, the Board has also taken several further regulatory steps. Among those steps is that the Board finalized a rule that would impose total loss-absorbing capacity and long-term debt requirements on U.S. global systemically important bank holding companies (G-SIBs) and on the U.S. operations of certain foreign G-SIBS.3 The final rule would require each covered firm to maintain a minimum amount of unsecured long-term debt that could be converted into equity in a possible resolution of that firm, thereby recapitalizing the firm without putting taxpayer funds at risk and diminishing the threat that its failure would pose to financial stability.
In addition, the Board completed an extensive review of its statutory stress test and Comprehensive Capital Analysis and Review (CCAR) programs and made some related modifications to the rules associated with those programs for the 2017 cycle.4 Among other changes, the Board removed certain large, noncomplex firms from the qualitative assessment of the CCAR.5 Moreover, the Board, together with the other federal banking agencies, issued an advance notice of proposed rulemaking, inviting public comment on a set of potential enhanced cybersecurity risk-management and resilience standards that would apply to depository institutions and regulated holding companies with over $50 billion in assets and to certain financial market infrastructure companies.6 The standards would be tiered, with an additional set of higher standards for systems that provide key functionality to the financial sector.
The Board and the Federal Deposit Insurance Corporation (FDIC) also have continued to actively engage in the resolution-planning process with the largest banks. As part of that process, the Board and the FDIC announced that Bank of America, BNY Mellon, JPMorgan Chase, and State Street adequately remediated deficiencies in their 2015 resolution plans. The two agencies also announced that Wells Fargo did not adequately remedy all of its deficiencies and will be subject to restrictions on certain activities until the deficiencies are remedied.7
...while risk spreads on corporate bonds narrowed
Bond spreads in the nonfinancial corporate sector declined significantly across the credit spectrum, suggesting increased investor confidence in the outlook for the corporate sector since the middle of last year. Declines in spreads were particularly large for firms in the energy sector, likely reflecting improved prospects for U.S. producers as they continue to increase efficiency and benefit from higher prices.
Treasury market functioning and liquidity conditions in the mortgage-backed securities market were generally stable
Indicators of Treasury market functioning remained broadly stable over the second half of 2016 and early 2017. A variety of liquidity metrics––including bid-asked spreads and bid sizes––have displayed minimal signs of liquidity pressures overall, with a modest reduction in liquidity following the U.S. elections. In addition, Treasury auctions generally continued to be well received by investors. Liquidity conditions in the agency MBS market were also generally stable.
The compliance deadline for money market mutual fund reform passed in mid-October with no market disruption
In the weeks leading up to the October 14, 2016, deadline for money market mutual funds (also referred to as money market funds, or MMFs) to comply with a variety of regulatory reforms, shifts in investments from prime to government MMFs were substantial. However, the transition was smooth and without any market disruptions. Overnight Eurodollar deposit volumes fell significantly and have remained low as prime funds pulled back from lending in this market. Meanwhile, the rise in total assets of government funds appeared to contribute to modestly higher levels of take-up at the overnight reverse repurchase agreement (ON RRP) facility through late 2016. Overnight money market rates were little affected, although the spread between the three-month LIBOR (London interbank offered rate) and the OIS (overnight index swap) rate has remained elevated, likely reflecting MMFs’ reduced appetite for term lending.
Bank credit continued to expand, and bank profitability improved
Aggregate credit provided by commercial banks continued to grow at a solid pace in the second half of 2016 (figure 34). The expansion in bank credit was driven by strong growth in core loans coupled with an increase in banks’ holdings of securities. Measures of bank profitability improved since the middle of last year but remained below their historical averages (figure 35).
Ratio of total commercial bank credit to nominal gross domestic product
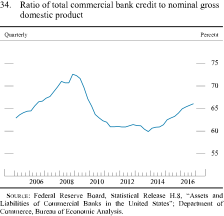
Source: Federal Reserve Board, Statistical Release H.8, "Assets and Liabilities of Commercial Banks in the United States"; Department of Commerce, Bureau of Economic Analysis.
Profitability of bank holding companies
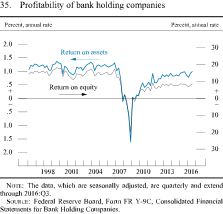
The data, which are seasonally adjusted, are quarterly and extend through 2016:Q3.
Source: Federal Reserve Board, Form FR Y-9C, Consolidated Financial Statements for Bank Holding Companies.
Municipal bond markets continued to function smoothly
Credit conditions in municipal bond markets have generally remained stable since late June. Over that period, the MCDX--an index of credit default swap spreads for a broad portfolio of municipal bonds--decreased moderately, while yield spreads on 20-year general obligation municipal bonds over comparable-maturity Treasury securities were little changed on balance. The Puerto Rico Oversight, Management, and Economic Stability Act was passed into law in late June, providing the commonwealth with a clearer path toward debt restructuring. Although Puerto Rico missed a small amount of debt payments on general obligation bonds in August, this default appeared to have had no significant effect on the broader municipal bond market.
International Developments
Foreign financial market conditions improved despite global political uncertainties
Financial market conditions in both the advanced foreign economies (AFEs) and the emerging market economies (EMEs) have generally improved since June. In the AFEs, increasing distance from the Brexit vote, better-than-expected economic data for Europe, and the continuation of accommodative monetary policies by advanced-economy central banks have contributed to improved risk sentiment. Advanced-economy bond yields reversed their downward trend seen in the first half of the year and increased notably following the U.S. elections, in part on expectations of a more expansionary U.S. fiscal policy (figure 36).
Equity prices in the AFEs have generally risen since June, with financial stocks outperforming broader stock indexes as third-quarter earnings largely beat expectations, several major risk events passed, and the steepening of yield curves was expected to boost profits going forward (figure 37). Despite some widening of euro-area corporate spreads in the last months of 2016, corporate credit conditions in the advanced foreign economies have remained accommodative, with the continuation of corporate asset purchase programs by several AFE central banks and with low corporate spreads.
10-year nominal benchmark yields in selected advanced economies
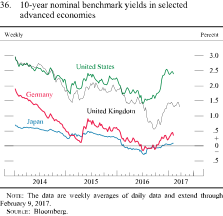
The data are weekly averages of daily data and extend through February 9, 2017.
Source: Bloomberg.
Series: United States, United Kingdom, Germany, and Japan 10-year benchmark yields Horizon: January 9, 2014, to February 9, 2017 Description: The data are weekly averages of daily data and are plotted as four curves. Units are in percent along the right axis. The curves generally move in the same direction from 2014 to 2016, with the United States and United Kingdom tracking closely until the middle of 2016 and both remaining above Germany and Japan. Germany starts considerably higher than Japan but dips briefly below Japan twice, in the first half of 2015 and near the end of 2016. The series for the United States starts in January 2014 at approximately 3 and gradually decreases to about 1.7 by midway through the first quarter of 2015. The series then climbs to around 2.4 by the beginning of the third quarter. It then fluctuates between 2.0 and just above 2.3 until the end of 2015. The series then declines to just above 1.7 in February 2016 before fluctuating between 1.7 and 1.95 through the beginning of June. The series dips to below 1.5 in the middle of 2016 before beginning to rise substantially around November 2016. The series peaks above 2.5 near the beginning of 2017. The series for the United Kingdom starts in January 2014 at just below 3 and gradually declines to about 1.45 by the middle of the first quarter of 2015. The series then increases to about 1.85 and decreases again back to around 1.5 in the end of the first quarter of 2015. The series then climbs to about 2.1 by the beginning of the third quarter and fluctuates between 1.75 and just above 2.0 until the end of 2015. The series then declines to about 1.4 by the middle of the first quarter of 2016 before fluctuating between about 1.4 and 1.6 through the end of May. The series then begins to fall rapidly around June of 2016, with the trough coming in the third quarter at around 0.5. The series then begins to recover, ending around 1.3. The series for Germany starts in January 2014 at around 1.9 and steadily decreases to just above 0.9 by midway through the third quarter. The series rebounds slightly to almost 1.1 at the end of the third quarter before continuing its steady decline to about 0.1 by the beginning of the second quarter of 2015. Then the series increases to about 0.9 by the end of the second quarter before declining to below 0.2 by the middle of the first quarter of 2016. It fluctuates between 0.1 and 0.3 through the beginning of June. The series dips below zero around the middle of 2016 and fluctuates near zero until the fourth quarter, when the series begins to rise, ending at just below 0.5. The series for Japan starts in January of 2014 at 0.7 and gradually declines to about 0.25 in early 2015. Beginning in February 2015, it slowly increases to almost 0.5 by the end of the second quarter of 2015. The series then declines to its lowest value of near -0.25 in the third quarter of 2016 before gradually rising just above zero by the series' end.
Equity indexes for selected foreign economies
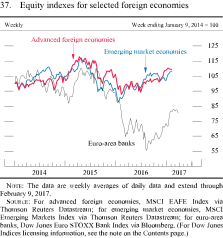
The data are weekly averages of daily data and extend through February 9, 2017.
Source: For advanced foreign economies, MSCI EAFE Index via Thomson Reuters Datastream; for emerging market economies, MSCI Emerging Markets Index via Thomson Reuters Datastream; for euro-area banks, Dow Jones Euro STOXX Bank Index via Bloomberg. (For Dow Jones Indices licensing information, see the note on the Contents page, or Figure 14.)
Series: Advanced foreign economies, emerging market economies, euro-area banks Horizon: January 9, 2014, through February 9, 2017 Description: The data are weekly averages of daily data, plotted as three curves. The unit along the right axis is an index with the week of January 9, 2014, equal to 100. The advanced foreign economies series and the emerging market economies series move roughly in the same direction, with the euro-area banks series tracking closely through the middle of 2015 before falling off substantially. The EME series extends higher than the AFE series through most of 2014. The EME series begins to decline around the end of the first quarter of 2015, while the AFE series also begins to fall off in the middle of 2015. Both series reach a trough around the beginning of 2016 before increasing gradually through the end of the series. The advanced foreign economies series fluctuates between about 95 and 102 in the beginning of 2014. The series then drops significantly around the beginning of the fourth quarter of 2014 before steadily increasing to around 115 in early 2015. The series then fluctuates around 115 until the third quarter of 2015, when the series suddenly drops to around 100. After regaining some ground, the series falls again around the beginning of 2016 to below 95. The series then fluctuates around 100, gradually increasing through the third quarter. The series then begins to rise quickly around end-2016 before steadying around 110 at the series' end. The emerging market economies series fluctuates between about 95 and 100 in the beginning of 2014 before gradually rising to above 110 through the third quarter of 2014. The series then decreases to below 105 before gradually rising to around 115 in early 2015. The series then falls off dramatically through mid-2015, regains some ground, and then falls off again with the trough just above 85 in early 2016. The series then begins to gradually increase, ending at around 110. The euro-area banks series shows volatility throughout the period. It has an upward trajectory through the beginning of 2014 before falling off beneath 95 in the middle of the year. The series then goes back up to around 105 before falling rapidly back below 95. It then decreases to almost 85 in early 2015 before rapidly rebounding to around 110 in the beginning of the second quarter. The series then stays near 105 until beginning a rapid fall in the third quarter, ending in the first quarter of 2016 around 65. The series falls off again in June until it reaches just above 55 in July. The series then trends up through the end of the series, with the pace accelerating in early December, before leveling out above 80.
In EMEs, equities have risen significantly and sovereign yield spreads have narrowed since June, supported in part by higher commodity prices. Financial conditions did tighten briefly following the U.S. elections, with increased capital outflows and wider sovereign spreads, on concerns that higher global interest rates, as well as the possibility of more protectionist trade policies, would weigh on EME growth (figure 38). However, the favorable risk sentiment seen in the summer and early fall of 2016 resumed by the end of the year for most EMEs.
Emerging market mutual fund flows and spreads
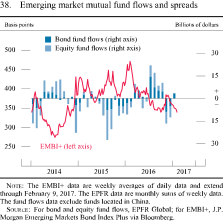
The EMBI+ data are weekly averages of daily data and extend through February 9, 2017. The EPFR data are monthly sums of weekly data. The fund flows data exclude funds located in China.
Source: For bond and equity fund flows, EPFR Global; for EMBI+, J.P. Morgan Emerging Markets Bond Index Plus via Bloomberg.
Series: Bond fund flows, equity fund flows, and EMBI+ Horizon: January 2014 through February 9, 2017 Description: EMBI+ data are weekly averages of daily data and are plotted as a curve. The units for EMBI+ are in basis points along the left axis. Bond and equity fund flows data are plotted as stacked bars. The units for both bond and equity fund flows are billions of dollars along the right axis. Both bond and equity fund flows are negative in early 2014 before becoming positive in the middle of the year and then falling off at the end of the year. The fund flows data are volatile, but they are generally negative for much of 2015 and early 2016. Fund flows are then positive through October 2016 before falling off at the end of the year. For EMBI+, the data fall for much of the first half of 2014 before trending up in the second half of the year. The EMBI+ series then shows significant volatility through 2015 before rapidly increasing and then falling off in early 2016. EMBI+ data begin around 340 before rapidly increasing to around 390 in early February and then trending down to around 275 in the middle of 2014. The data then trend up through the end of 2014, with the pace rapidly accelerating in December. The series falls off again in early 2015 before trending up and reaching about 445 in August and then falling back to around 380. The series trends up again in early 2016, reaching about 470 in February. The series then decreases through the rest of 2016, reaching 340 in October before trending up to around 380 in early December. The series then decreases through the end of the period, and ends at about 340. Both bond and equity fund flows are negative for the first quarter of 2014, with the magnitudes for equities larger than those for bonds each month. The data turn positive in the second quarter before decreasing to near zero in October and November. The data are negative with significant magnitudes in December and January, with especially large equity fund flows. After a brief period with both equity and bond fund flows near zero, the data once again show significant outflows for both equity and bond funds from the middle of 2015 through early 2016, except for a single month of positive equity fund flows in October. Beginning in the middle of 2016, there is a brief period of positive and large inflows into both equity and bond funds. In late 2016, there are pronounced outflows from both equity and bond funds before a return to moderate inflows in January 2017.
After depreciating slightly in the first half of last year, the dollar strengthened in the second half
The dollar has strengthened since June, with the broad dollar index--a measure of the trade-weighted value of the dollar against foreign currencies--rising about 4 percent on balance (figure 39). Much of this strengthening of the U.S. dollar reflects the combined influences of the large depreciation of the Mexican peso, expectations of fiscal and trade policy changes after the U.S. elections, and market expectations of tighter Federal Reserve monetary policy. The Chinese renminbi also weakened notably against the dollar, on net, as capital outflows from China picked up; Chinese authorities tightened capital controls in response.
U.S. dollar exchange rate indexes
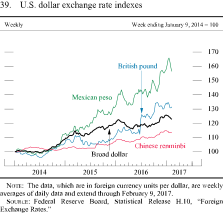
The data, which are in foreign currency units per dollar, are weekly averages of daily data and extend through February 9, 2017.
Source: Federal Reserve Board, Statistical Release H.10, "Foreign Exchange Rates."
In general, AFE economic growth was moderate and inflation remained subdued
In Canada, economic growth picked up sharply in the third quarter, following a contraction in the previous quarter, as oil extraction recovered from the disruptions caused by wildfires in May (figure 40). In contrast, economic growth in Japan in the second and third quarters slowed after a strong first quarter, returning to a more typical moderate pace. Euro-area growth firmed in the second half, and, in the United Kingdom, economic activity was resilient in the aftermath of the Brexit referendum in June. Available indicators suggest that growth in most AFEs was moderate near the end of 2016 and early this year.
Headline inflation in most AFEs increased over the second half of 2016, in part driven by higher oil prices. In the United Kingdom, the substantial sterling depreciation after the Brexit referendum also exerted upward pressure on consumer prices. Even so, core inflation readings in AFEs remained generally subdued, and headline inflation stayed below central bank targets in Canada, the euro area, Japan, and the United Kingdom (figure 41).
Real gross domestic product growth in selected advanced foreign economies
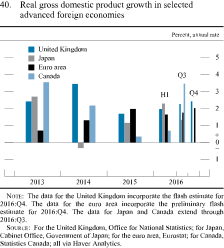
The data for the United Kingdom incorporate the flash estimate for 2016:Q4. The data for the euro area incorporate the preliminary flash estimate for 2016:Q4. The data for Japan and Canada extend through 2016:Q3.
Source: For the United Kingdom, Office for National Statistics; for Japan, Cabinet Office, Government of Japan; for the euro area, Eurostat; for Canada, Statistics Canada; all via Haver Analytics.
Inflation in selected advanced foreign economies
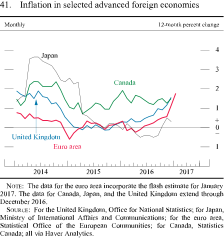
The data for the euro area incorporate the flash estimate for January 2017. The data for Canada, Japan, and the United Kingdom extend through December 2016.
Source: For the United Kingdom, Office for National Statistics; for Japan, Ministry of International Affairs and Communications; for the euro area, Statistical Office of the European Communities; for Canada, Statistics Canada; all via Haver Analytics.
AFE central banks maintained highly accommodative monetary policies
In August, the Bank of England cut its policy rate 25 basis points, announced additional purchases of government and corporate bonds, and introduced a term funding scheme. In September, the Bank of Japan committed to expanding the monetary base until inflation exceeds 2 percent in a stable manner and adopted a new policy framework aimed at controlling the yield curve by targeting short- and long-term interest rates. In December, the European Central Bank announced an extension of the intended duration of its asset purchases through at least December 2017, albeit with a slight reduction in those purchases beginning in April 2017.
In EMEs, Asian growth was solid...
Chinese economic activity remained robust in the second half of 2016, as earlier policy easing supported stable manufacturing growth and a strong property market (figure 42). However, the property market cooled somewhat toward the end of the year following the introduction of new macroprudential measures aimed at curbing rapidly rising house prices. Elsewhere in emerging Asia, growth held steady in the third quarter but stepped down in some countries in the fourth, even though exports and manufacturing improved. And in India, a surprise mandatory exchange of large-denomination bank notes--a move aimed at battling tax evasion and corruption--has disrupted activity.
Real gross domestic product growth in selected emerging market economies
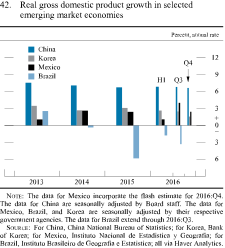
The data for Mexico incorporate the flash estimate for 2016:Q4. The data for China are seasonally adjusted by Board staff. The data for Mexico, Brazil, and Korea are seasonally adjusted by their respective government agencies. The data for Brazil extend through 2016:Q3.
Source: For China, China National Bureau of Statistics; for Korea, Bank of Korea; for Mexico, Instituto Nacional de Estadistica y Geografia; for Brazil, Instituto Brasileiro de Geografia e Estatistica; all via Haver Analytics.
...but many Latin American economies continued to struggle
In Mexico, after considerable weakness in the first half of 2016, growth surged in the third quarter, supported in part by a recovery in exports to the United States. However, activity weakened again in the fourth quarter, as consumer and business confidence dropped. Furthermore, inflation in Mexico jumped over the second half of the year, pressured in part by the peso’s sizable depreciation, prompting the Bank of Mexico to hike its policy rate sharply. Brazil’s recession deepened in the third quarter, reflecting in part tight macroeconomic policies, although the central bank began to ease monetary policy as inflation dropped in response to the weak economy. Elsewhere in the region, activity in the third quarter was mixed; Chile’s economy rebounded, but Argentina’s GDP contracted and the crisis in Venezuela deepened.
Footnotes
Monetary Policy
In December, the Federal Open Market Committee (FOMC) raised the target for the federal funds rate by ¼ percentage point to a range of 1/2 to 3/4 percent. The FOMC’s decision reflected realized and expected labor market conditions and inflation. Moreover, the decision to raise the target range was consistent with the Committee’s expectation that, with gradual adjustments in the stance of monetary policy, economic activity would expand at a moderate pace, labor market conditions would strengthen somewhat further, and inflation would rise to the FOMC’s 2 percent objective over the medium term. The Committee expects that economic conditions will evolve in a manner that will warrant only gradual increases in the federal funds rate; the federal funds rate is likely to remain, for some time, below levels that are expected to prevail in the longer run. However, the actual path of the federal funds rate will depend on the economic outlook as informed by incoming data. In addition, the Committee anticipates reinvesting principal payments of its securities holdings until normalization of the level of the federal funds rate is well under way. In December, the Federal Open Market Committee (FOMC) raised the target for the federal funds rate by ¼ percentage point to a range of 1/2 to 3/4 percent. The FOMC’s decision reflected realized and expected labor market conditions and inflation. Moreover, the decision to raise the target range was consistent with the Committee’s expectation that, with gradual adjustments in the stance of monetary policy, economic activity would expand at a moderate pace, labor market conditions would strengthen somewhat further, and inflation would rise to the FOMC’s 2 percent objective over the medium term. The Committee expects that economic conditions will evolve in a manner that will warrant only gradual increases in the federal funds rate; the federal funds rate is likely to remain, for some time, below levels that are expected to prevail in the longer run. However, the actual path of the federal funds rate will depend on the economic outlook as informed by incoming data. In addition, the Committee anticipates reinvesting principal payments of its securities holdings until normalization of the level of the federal funds rate is well under way.
The FOMC raised the federal funds rate target range in December
About a year ago, in December 2015, the FOMC raised the target range for the federal funds rate after holding the range at near zero since late 2008 to support economic activity and stem disinflationary pressures in the wake of the Great Recession. At that time, the Committee judged that it had seen sufficient improvement in the labor market and was reasonably confident that inflation would move back to its 2 percent objective, which would warrant an initial increase in the federal funds rate. Through most of 2016, the Committee maintained the target range of 1/4 to 1/2 percent, pending further evidence of continued progress toward its objectives. In December, in view of realized and expected labor market conditions and inflation, the FOMC raised the target range for the federal funds rate another 1/4 percentage point, to a range of 1/2 to 3/4 percent (figure 43).3 The Committee kept that same target range at its most recent meeting, which concluded on February 1.
Selected interest rates
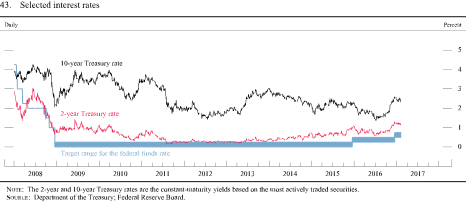
The 2-year and 10-year Treasury rates are the constant-maturity yields based on the most actively traded securities.
Source: Department of the Treasury.
Monetary policy continues to support the economic expansion
The Committee has continued to see the federal funds rate as likely to remain, for some time, below the levels that are expected to prevail in the longer run. With gradual adjustments in the stance of monetary policy, the FOMC expects that economic activity will expand at a moderate pace, labor market conditions will strengthen somewhat further, and inflation will rise to 2 percent over the medium term.
Consistent with this outlook, in the most recent Summary of Economic Projections (included as Part 3 of this report), which was compiled at the time of the December 2016 meeting, most participants projected that the appropriate level of the federal funds rate would be below its longer-run level through 2018.
Future changes in the federal funds rate will depend on the economic outlook as informed by incoming data
Although the Committee has expected that economic conditions will evolve in a manner that will warrant only gradual increases in the federal funds rate, the Committee has continued to emphasize that the actual path of monetary policy will depend on the evolution of the economic outlook. In determining the timing and size of future adjustments to the target range for the federal funds rate, the Committee will assess realized and expected economic conditions relative to its objectives of maximum employment and 2 percent inflation. This assessment will take into account a wide range of information, including measures of labor market conditions, indicators of inflation pressures and inflation expectations, and readings on financial and international developments. In light of the current shortfall of inflation from 2 percent, the Committee has indicated that it will carefully monitor actual and expected progress toward its inflation goal.
The size of the Federal Reserve’s balance sheet has remained stable
To help maintain accommodative financial conditions, the Committee has continued its existing policy of rolling over maturing Treasury securities at auction and reinvesting principal payments on all agency debt and agency mortgage-backed securities in agency mortgage-backed securities. The Federal Reserve’s total assets have held steady at around $4.5 trillion, with holdings of U.S. Treasury securities at $2.5 trillion and holdings of agency debt and agency mortgage-backed securities at approximately $1.8 trillion (figure 44). The Committee has for some time stated that it anticipates maintaining this policy until normalization of the level of the federal funds rate is well under way.
Federal Reserve assets and liabilities
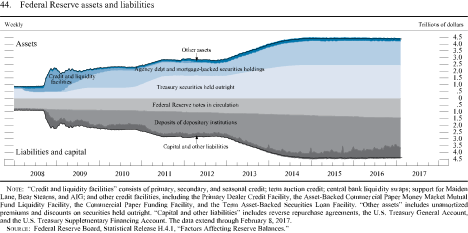
Data values are rounded and may not sum to totals. "Capital and other liabilities" includes reverse repurchase agreements, the U.S. Treasury General Account, and the U.S. Treasury Supplementary Financing Account. The data extend through February 8, 2017.
Source: Federal Reserve Board, Statistical Release H.4.1, "Factors Affecting Reserve Balances."
Interest income on the System Open Market Account, or SOMA, portfolio has continued to support substantial remittances to the U.S. Treasury. Preliminary results indicate that the Reserve Banks provided for payments of $92 billion of their estimated 2016 net income to the Treasury. The Federal Reserve’s remittances to the Treasury have averaged about $80 billion a year since 2008, compared with about $25 billion a year over the decade prior to 2008.4
The Federal Reserve’s implementation of monetary policy has continued smoothly
As in December 2015, the Federal Reserve successfully raised the effective federal funds rate in December 2016 using the interest rate paid on reserve balances, together with an overnight reverse repurchase agreement (ON RRP) facility.5 Specifically, the Federal Reserve raised the interest rate paid on required and excess reserve balances to 3/4 percent and the ON RRP offering rate to ½ percent. In addition, the Board of Governors approved an increase in the discount rate (the primary credit rate) to 1.25 percent. The effective federal funds rate rose into the new range amid orderly trading conditions in money markets. Increases in interest rates in other money markets were similar to the rise in the federal funds rate following the December meeting.
The total take-up at the ON RRP facility increased modestly in the second half of 2016 as a result of higher demand by government money market mutual funds in the wake of money fund reform that took effect in mid-October.
Although the implementation of monetary policy has been smooth, the Federal Reserve has continued to test the operational readiness of other policy tools as part of prudent planning. Two operations of the Term Deposit Facility were conducted in the second half of 2016; seven-day deposits were offered at both operations with a floating rate of 1 basis point over the interest rate on excess reserves. In addition, the Open Market Desk conducted several small-value exercises solely for the purpose of maintaining operational readiness.
Footnotes
Summary of Economic Projections
The following material appeared as an addendum to the minutes of the December 13-14, 2016, meeting of the Federal Open Market Committee. The following material appeared as an addendum to the minutes of the December 13-14, 2016, meeting of the Federal Open Market Committee.
In conjunction with the Federal Open Market Committee (FOMC) meeting held on December 13-14, 2016, meeting participants submitted their projections of the most likely outcomes for real output growth, the unemployment rate, and inflation for each year from 2016 to 2019 and over the longer run.6 Each participant’s projection was based on information available at the time of the meeting, together with his or her assessment of appropriate monetary policy, including a path for the federal funds rate and its longer-run value, and assumptions about other factors likely to affect economic outcomes. The longer-run projections represent each participant’s assessment of the value to which each variable would be expected to converge, over time, under appropriate monetary policy and in the absence of further shocks to the economy. “Appropriate monetary policy” is defined as the future path of policy that each participant deems most likely to foster outcomes for economic activity and inflation that best satisfy his or her individual interpretation of the Federal Reserve’s objectives of maximum employment and stable prices.
Most FOMC participants expected that, under appropriate monetary policy, growth in real gross domestic product (GDP) would pick up a bit next year and run at or slightly above their individual estimates of its longer-run rate through 2019. Almost all participants projected that the unemployment rate would run below their estimates of its longer-run normal level in 2017 and remain below that level through 2019. All participants projected that inflation, as measured by the four-quarter percentage change in the price index for personal consumption expenditures (PCE), would increase over the next two years, and several expected inflation to slightly exceed the Committee’s 2 percent objective in 2018 or 2019. Table 1 and figure 1 provide summary statistics for the projections.
As shown in figure 2, almost all participants expected that the evolution of economic conditions would warrant only gradual increases in the federal funds rate to achieve and sustain maximum employment and 2 percent inflation. Many participants judged that the appropriate level of the federal funds rate in 2019 would be close to their estimates of its longer-run normal level. However, the economic outlook is uncertain, and participants noted that their economic projections and assessments of appropriate monetary policy may change in response to incoming information.
A majority of participants viewed the level of uncertainty associated with their individual forecasts for economic growth, unemployment, and inflation as broadly similar to the norms of the previous 20 years, though some participants saw uncertainty associated with their forecasts as higher than average. Most participants also judged the risks around their projections for economic activity, the unemployment rate, and inflation as broadly balanced, while several participants saw the risks to their forecasts of real GDP growth as weighted to the upside and the risks to their unemployment rate forecasts as tilted to the downside.
Table 1. Economic projections of Federal Reserve Board members and Federal Reserve Bank presidents, under their individual assessments of projected appropriate monetary policy, December 2016
Note: Projections of change in real gross domestic product (GDP) and projections for both measures of inflation are percent changes from the fourth quarter of the previous year to the fourth quarter of the year indicated. PCE inflation and core PCE inflation are the percentage rates of change in, respectively, the price index for personal consumption expenditures (PCE) and the price index for PCE excluding food and energy. Projections for the unemployment rate are for the average civilian unemployment rate in the fourth quarter of the year indicated. Each participant’s projections are based on his or her assessment of appropriate monetary policy. Longer-run projections represent each participant’s assessment of the rate to which each variable would be expected to converge under appropriate monetary policy and in the absence of further shocks to the economy. The projections for the federal funds rate are the value of the midpoint of the projected appropriate target range for the federal funds rate or the projected appropriate target level for the federal funds rate at the end of the specified calendar year or over the longer run. The September projections were made in conjunction with the meeting of the Federal Open Market Committee on September 20–21, 2016. One participant did not submit longer-run projections for the change in real GDP, the unemployment rate, or the federal funds rate in conjunction with the September 20–21, 2016, meeting, and one participant did not submit such projections in conjunction with the December 13–14, 2016, meeting.
1. For each period, the median is the middle projection when the projections are arranged from lowest to highest. When the number of projections is even, the median is the average of the two middle projections. Return to table
2. The central tendency excludes the three highest and three lowest projections for each variable in each year. Return to table
3. The range for a variable in a given year includes all participants’ projections, from lowest to highest, for that variable in that year. Return to table
4. Longer-run projections for core PCE inflation are not collected. Return to table
Part 3, Figure 1. Medians, central tendencies, and ranges of economic projects, 2016–19 over the longer run
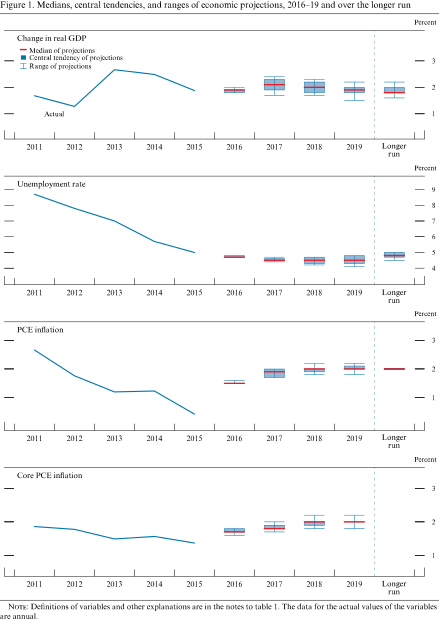
Part 3, Figure 2. FOMC participants’ assessments of appropriate monetary policy: Midpoint of target range or target level for the federal funds rate
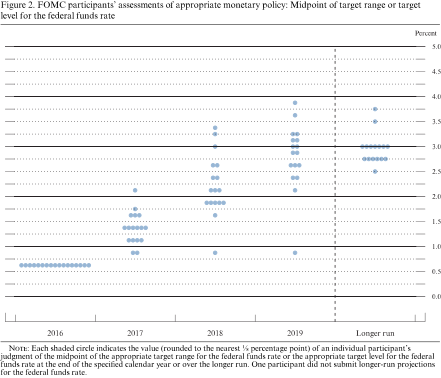
The Outlook for Economic Activity
The median of participants’ projections for the growth rate of real GDP, conditional on their individual assumptions about appropriate monetary policy, was 1.9 percent in 2016, 2.1 percent in 2017, 2.0 percent in 2018, and 1.9 percent in 2019; the median of projections for the longer-run normal rate of real GDP growth was 1.8 percent. Most participants projected that economic growth would pick up a bit in 2017 from the current year’s pace and run at or slightly above their individual estimates of its longer-run rate through 2019. Compared with the September Summary of Economic Projections (SEP), the medians of the projections for real GDP growth were slightly higher over the period from 2017 to 2019, while the median assessment of the longer-run growth rate was unchanged. Since September, almost half of the participants revised up their projections for real GDP growth in 2018 or 2019, generally only slightly. Those increasing their projections for output growth in those years cited expected changes in fiscal, regulatory, or other policies as factors contributing to their revisions. However, many participants noted that the effects on the economy of such policy changes, if implemented, would likely be partially offset by tighter financial conditions, including higher longer-term interest rates and a strengthening of the dollar.
The median of projections for the unemployment rate in the fourth quarter of 2016 was 4.7 percent, slightly lower than in September. Based on the median projections, the anticipated path of the unemployment rate for coming years also shifted down a bit, with the median for the end of 2019 at 4.5 percent, 0.3 percentage point below the median assessment of the longer-run normal rate of unemployment, which was unchanged from September.
Figures 3.A and 3.B show the distributions of participants’ projections for real GDP growth and the unemployment rate from 2016 to 2019 and in the longer run. The distributions of individual projections of real GDP growth shifted slightly higher relative to the distribution of the September projections for 2017 through 2019. The distributions of projections for the unemployment rate shifted modestly lower for 2016 through 2019, while the distribution of projections for the longer-run normal rate of unemployment was unchanged.
Distribution of participants’ projections for the change in real GDP, 2016–19 and over the longer run
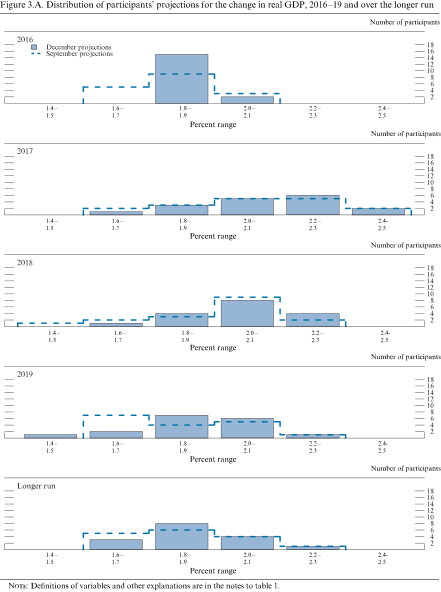
Definitions of variables and other explanations are in the notes to table 1.
Distribution of participants’ projections for the unemployment rate, 2016–19 and over the longer run
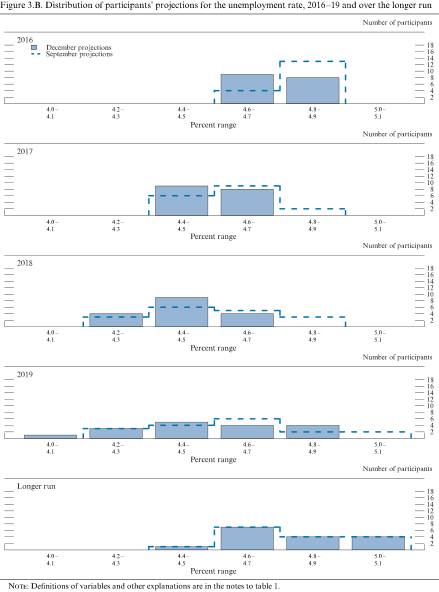
Definitions of variables and other explanations are in the notes to table 1.
The Outlook for Inflation
In the December SEP, the median of projections for headline PCE price inflation in 2016 was 1.5 percent, a bit higher than in September. The median of projections for headline PCE price inflation was 1.9 percent in 2017 and 2.0 percent in 2018 and 2019, unchanged from September. Several participants projected that inflation will slightly exceed the Committee’s objective in 2018 or 2019. The medians of projections for core PCE price inflation were the same as in September, rising from 1.7 percent in 2016 to 1.8 percent in 2017 and 2.0 percent in 2018 and 2019.
Figures 3.C and 3.D provide information on the distribution of participants’ views about the outlook for inflation. The distributions of projections for headline and core PCE price inflation shifted up slightly relative to projections for the September meeting. Some participants attributed the upward shift in projected inflation this year and next to recent data that showed somewhat higher inflation than they had expected. A few saw higher inflation in 2019 in conjunction with somewhat greater undershooting of the unemployment rate below its longer-run normal level.
Distribution of participants’ projections for PCE inflation, 2016–19 and over the longer run
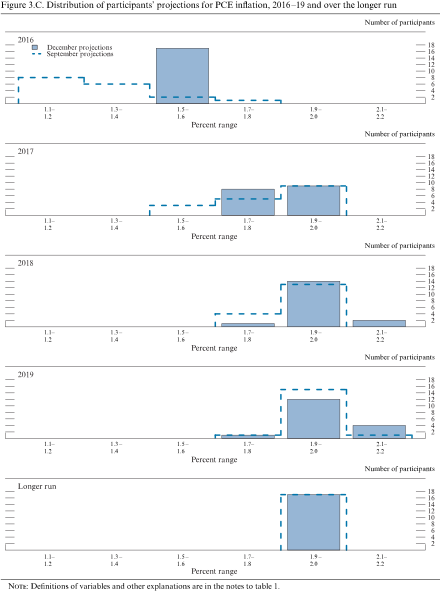
Definitions of variables and other explanations are in the notes to table 1.
Distribution of participants’ projections for core PCE inflation, 2016–19
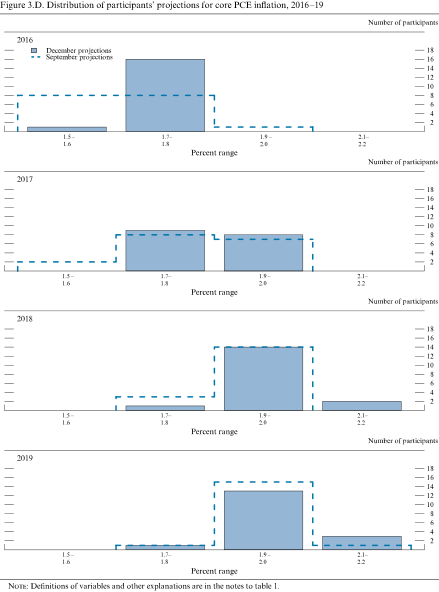
Definitions of variables and other explanations are in the notes to table 1.
Appropriate Monetary Policy
Figure 3.E provides the distribution of participants’ judgments regarding the appropriate target for the federal funds rate at the end of each year from 2016 to 2019 and over the longer run.7 All participants saw an increase of 25 basis points in the federal funds rate at the December meeting as appropriate. The distributions for 2017 through 2019 shifted up modestly. The median projections of the federal funds rate continued to show gradual increases, to 1.4 percent at the end of 2017, 2.1 percent at the end of 2018, and 2.9 percent at the end of 2019; the median of the longer-run projections of the federal funds rate was 3.0 percent. The medians of the projections for the level of the federal funds rate for 2017 through 2019 were all 25 basis points higher than in the September projections. A few participants revised up their assessments of the longer-run federal funds rate 25 basis points, resulting in an increase in the median of 13 basis points.
Distribution of participants’ judgments of the midpoint of the appropriate target range for the federal funds rate or the appropriate target level for the federal funds rate, 2016–19 and over the longer run
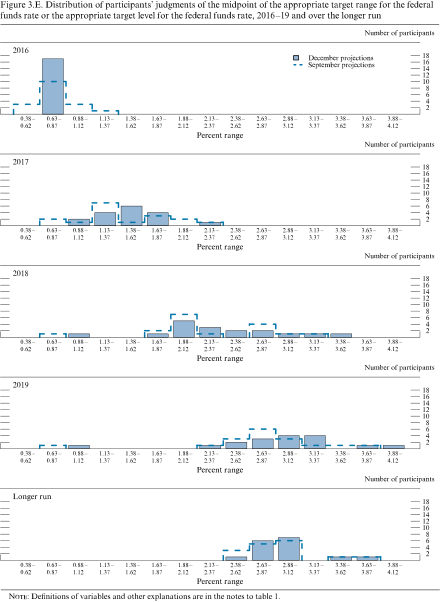
Definitions of variables and other explanations are in the notes to table 1.
Table 2. Average historical projection error ranges Percentage points
Note: Error ranges shown are measured as plus or minus the root mean squared error of projections for 1996 through 2015 that were released in the winter by various private and government forecasters. (The note to this table that was included in the Summary of Economic Projections for the meeting of September 20–21, 2016, incorrectly stated that the error ranges were based on projections for 1995 through 2015. The correct time period was 1996 through 2015.) As described in the box “ Forecast Uncertainty,” under certain assumptions, there is about a 70 percent probability that actual outcomes for real GDP, unemployment, and consumer prices will be in ranges implied by the average size of projection errors made in the past. For more information, see David Reifschneider and Peter Tulip (2007), “Gauging the Uncertainty of the Economic Outlook from Historical Forecasting Errors,” Finance and Economics Discussion Series 2007-60 (Washington: Board of Governors of the Federal Reserve System, November), available at www.federalreserve.gov/pubs/feds/2007/200760/200760abs.html; and Board of Governors of the Federal Reserve System, Division of Research and Statistics (2014), “Updated Historical Forecast Errors,” memorandum, April 9, www.federalreserve.gov/foia/files/20140409-historical-forecast-errors.pdf.
1. Definitions of variables are in the general note to table 1. Return to table
2. Measure is the overall consumer price index, the price measure that has been most widely used in government and private economic forecasts. Projection is percent change, fourth quarter of the previous year to the fourth quarter of the year indicated. Return to table
In discussing their December forecasts, many participants expressed a view that increases in the federal funds rate over the next few years would likely be gradual in light of a short-term neutral real interest rate that currently was low--a phenomenon that a number of participants attributed to the persistence of low productivity growth, continued strength of the dollar, a weak outlook for economic growth abroad, strong demand for safe longer-term assets, or other factors--and that was likely to rise only slowly as the effects of these factors faded over time. Some participants noted the continued proximity of short-term nominal interest rates to the effective lower bound, even with an increase at this meeting, as limiting the Committee’s ability to increase monetary accommodation to counter possible adverse shocks to the economy. These participants judged that, as a result, the Committee should take a cautious approach to removing policy accommodation. Many participants noted that there was currently substantial uncertainty about the size, composition, and timing of prospective fiscal policy changes, but they also commented that a more expansionary fiscal policy might raise aggregate demand above sustainable levels, potentially necessitating somewhat tighter monetary policy than currently anticipated. Furthermore, several participants indicated that recent inflation data and the continued strengthening in labor market conditions increased their confidence that inflation would move toward the 2 percent objective, making a slightly firmer path of monetary policy appropriate.
Uncertainty and Risks
The left-hand column of figure 4 shows that, for each variable, a majority of participants judged the levels of uncertainty associated with their December projections for real GDP growth, the unemployment rate, headline inflation, and core inflation to be broadly similar to the average of the past 20 years.8 However, more participants than in September saw uncertainty surrounding real GDP growth, the unemployment rate, or inflation as higher than average. Many participants mentioned an increase in uncertainty associated with fiscal, trade, immigration, or regulatory policies as a factor influencing their judgments about the degree of uncertainty surrounding their projections. Participants cited the difficulty of predicting the size, composition, and timing of these policy changes as well as the magnitude and timing of their effects on the economy.
As can be seen in the right-hand column of figure 4, a majority of participants continued to see the risks to real GDP growth, the unemployment rate, headline inflation, and core inflation as broadly balanced; however, fewer participants saw risks to economic growth and inflation as weighted to the downside or saw risks to the unemployment rate as weighted to the upside than in September. A number of participants noted that the prospect of expansionary fiscal policy had increased the upside risks to economic activity and inflation, and a few assessed the possibility of a reduction in regulation as posing upside risks to their forecasts of economic activity. Moreover, some participants judged that the recent rise in market-based measures of inflation compensation suggested that downside risks to inflation had declined. However, many also pointed to various sources of downside risk to economic activity, such as the limited potential for monetary policy to respond to adverse shocks when the federal funds rate is near the effective lower bound, downside risks in Europe and China, a possible increase in trade barriers, and the possibility of a sharp rise in financial market volatility in the event that fiscal and other policy changes diverged from market expectations. In addition, some participants pointed to factors such as global disinflationary trends and downward pressure on import prices from further strengthening of the dollar as sources of downside risk to inflation.
Uncertainty and risks in economic projections
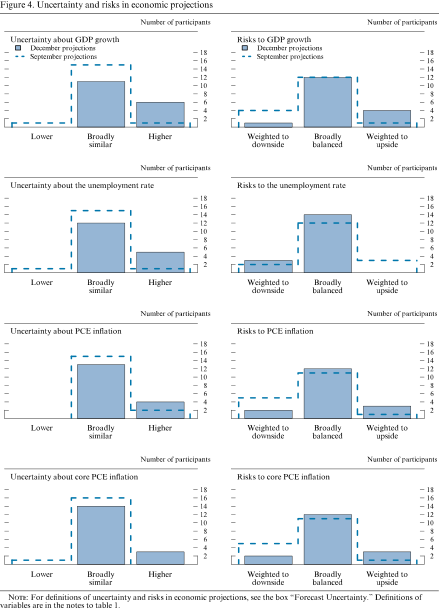
For definitions of uncertainty and risks in economic projections, see the box "Forecast Uncertainty." Definitions of variables are in the notes to table 1.
Forecast Uncertainty
The economic projections provided by the members of the Board of Governors and the presidents of the Federal Reserve Banks inform discussions of monetary policy among policymakers and can aid public understanding of the basis for policy actions. Considerable uncertainty attends these projections, however. The economic and statistical models and relationships used to help produce economic forecasts are necessarily imperfect descriptions of the real world, and the future path of the economy can be affected by myriad unforeseen developments and events. Thus, in setting the stance of monetary policy, participants consider not only what appears to be the most likely economic outcome as embodied in their projections, but also the range of alternative possibilities, the likelihood of their occurring, and the potential costs to the economy should they occur.
Table 2 summarizes the average historical accuracy of a range of forecasts, including those reported in past Monetary Policy Reportsand those prepared by the Federal Reserve Board’s staff in advance of meetings of the Federal Open Market Committee. The projection error ranges shown in the table illustrate the considerable uncertainty associated with economic forecasts. For example, suppose a participant projects that real gross domestic product (GDP) and total consumer prices will rise steadily at annual rates of, respectively, 3 percent and 2 percent. If the uncertainty attending those projections is similar to that experienced in the past and the risks around the projections are broadly balanced, the numbers reported in table 2 would imply a probability of about 70 percent that actual GDP would expand within a range of 2.1 to 3.9 percent in the current year, 1.3 to 4.7 percent in the second year, and 0.9 to 5.1 percent in the third and fourth years. The corresponding 70 percent confidence intervals for overall inflation would be 1.8 to 2.2 percent in the current year, 1.0 to 3.0 in the second year, and 0.9 to 3.1 percent in the third and fourth years.
Because current conditions may differ from those that prevailed, on average, over history, participants provide judgments as to whether the uncertainty attached to their projections of each variable is greater than, smaller than, or broadly similar to typical levels of forecast uncertainty in the past, as shown in table 2. Participants also provide judgments as to whether the risks to their projections are weighted to the upside, are weighted to the downside, or are broadly balanced. That is, participants judge whether each variable is more likely to be above or below their projections of the most likely outcome. These judgments about the uncertainty and the risks attending each participant’s projections are distinct from the diversity of participants’ views about the most likely outcomes. Forecast uncertainty is concerned with the risks associated with a particular projection rather than with divergences across a number of different projections.
As with real activity and inflation, the outlook for the future path of the federal funds rate is subject to considerable uncertainty. This uncertainty arises primarily because each participant’s assessment of the appropriate stance of monetary policy depends importantly on the evolution of real activity and inflation over time. If economic conditions evolve in an unexpected manner, then assessments of the appropriate setting of the federal funds rate would change from that point forward.