July 2013 Monetary Policy Report: Full Text
Summary
Thus far this year, labor market conditions have improved further, while consumer price inflation has run below the Federal Open Market Committee's (FOMC) longer-run objective of 2 percent. Gains in payroll employment since the start of the year have averaged about 200,000 jobs per month, and various measures of underutilization in labor markets have continued to trend down. Even so, the unemployment rate, at 7-1/2 percent in June, was still well above levels prevailing prior to the recent recession and well above the levels that FOMC participants think can be sustained in the longer term consistent with price stability.
Consumer price inflation has slowed this year. Over the first five months of the year, the price index for personal consumption expenditures increased at an annual rate of only 1/2 percent, while the index excluding food and energy prices rose at a rate of 1 percent, both down from increases of about 1-1/2 percent over 2012. This slowing appears to owe partly to transitory factors. Survey measures of longer-term inflation expectations have remained in the narrow ranges seen over the past several years, while market-based measures have declined so far this year, reversing their rise over the second half of 2012.
Meanwhile, real gross domestic product (GDP) continued to increase at a moderate pace in the first quarter of this year. Available indicators suggest that the growth of real GDP proceeded at a somewhat slower pace in the second quarter. Although federal fiscal policy is imposing a substantial drag on growth this year and export demand is still damped by subdued growth in foreign economies, some of the other headwinds that have weighed on the economic recovery have begun to dissipate. Against this backdrop, a sustained housing market recovery now appears to be under way, and consumption growth is estimated to have held up reasonably well despite the increase in taxes earlier this year.
Credit conditions generally have eased further, though they remain relatively tight for households with lower credit scores--and especially for such households seeking mortgage loans. However, beginning in May, longer-term interest rates rose significantly and asset price volatility increased as investors responded to somewhat better-than-expected economic data as well as Federal Reserve communications about monetary policy. Despite their recent moves, interest rates have generally remained low by historical standards, importantly due to the Federal Reserve's highly accommodative monetary policy stance.
With unemployment still well above normal levels and inflation quite low, and with the economic recovery anticipated to pick up only gradually, the FOMC has continued its highly accommodative monetary policy this year in order to support progress toward maximum employment and price stability.
The FOMC kept its target range for the federal funds rate at 0 to 1/4 percent and anticipated that this exceptionally low range would be appropriate at least as long as the unemployment rate remains above 6-1/2 percent, inflation between one and two years ahead is projected to be no more than a half percentage point above the Committee's 2 percent longer-run goal, and longer-term inflation expectations continue to be well anchored. The Committee also stated that when it decides to begin to remove policy accommodation, it would take a balanced approach consistent with its longer-run goals of maximum employment and inflation of 2 percent.
The FOMC also has continued its asset purchase program, purchasing additional agency mortgage-backed securities at a pace of $40 billion per month and longer-term Treasury securities at a pace of $45 billion per month. The Committee has reiterated that the purchase program will continue until the outlook for the labor market has improved substantially in a context of price stability. In addition, the FOMC has indicated that the size, pace, and composition of purchases will be adjusted in light of the Committee's assessment of the likely efficacy and costs of such purchases as well as the extent of progress toward its economic objectives. The Committee has noted that it is prepared to increase or reduce the pace of purchases to maintain appropriate policy accommodation as the outlook for the labor market or inflation changes.
At the June FOMC meeting, Committee participants generally thought it would be helpful to provide greater clarity about the Committee's approach to decisions about its asset purchase program and thereby reduce investors' uncertainty about how the Committee might react to future economic developments. In choosing to provide this clarification, the Committee made no changes to its approach to monetary policy. Against this backdrop, Chairman Bernanke, at his postmeeting press conference, described a possible path for asset purchases that the Committee would anticipate implementing if economic conditions evolved in a manner broadly consistent with the outcomes the Committee saw as most likely. The Chairman noted that such economic outcomes involved continued gains in labor markets, supported by moderate growth that picks up over the next several quarters, and inflation moving back toward its 2 percent objective over time. If the economy were to evolve broadly in line with the Committee's expectations, the FOMC would moderate the pace of purchases later this year and continue to reduce the pace of purchases in measured steps until purchases ended around the middle of next year, at which time the unemployment rate would likely be in the vicinity of 7 percent, with solid economic growth supporting further job gains and inflation moving back toward the FOMC's 2 percent target. In emphasizing that the Committee's policy was in no way predetermined, the Chairman noted that the pace of asset purchases could increase or decrease depending on the evolution of the outlook and its implications for further progress in the labor market. The Chairman also drew a strong distinction between the asset purchase program and the forward guidance regarding the target for the federal funds rate, noting that the Committee anticipates that there will be a considerable period between the end of asset purchases and the time when it becomes appropriate to increase the target for the federal funds rate.
In conjunction with the most recent FOMC meeting in June, Committee participants submitted individual economic projections under each participant's judgment of appropriate monetary policy. According to the Summary of Economic Projections (SEP), Committee participants saw the downside risks to the outlook for the economy and the labor market as having diminished since the fall. (The June SEP is included as Part 3 of this report.) Committee participants also projected that, with appropriate monetary policy accommodation, economic growth would pick up, the unemployment rate would gradually decline, and inflation would move up over the medium term from recent very low readings and subsequently move back toward the FOMC's 2 percent longer-run objective. Committee participants saw increases in the target for the federal funds rate as being quite far in the future, with most expecting the first increase to occur in 2015 or 2016.
Statement on Longer-Run Goals and Monetary Policy Strategy
The Federal Open Market Committee (FOMC) is firmly committed to fulfilling its statutory mandate from the Congress of promoting maximum employment, stable prices, and moderate long-term interest rates. The Committee seeks to explain its monetary policy decisions to the public as clearly as possible. Such clarity facilitates well-informed decisionmaking by households and businesses, reduces economic and financial uncertainty, increases the effectiveness of monetary policy, and enhances transparency and accountability, which are essential in a democratic society.
Inflation, employment, and long-term interest rates fluctuate over time in response to economic and financial disturbances. Moreover, monetary policy actions tend to influence economic activity and prices with a lag. Therefore, the Committee's policy decisions reflect its longer-run goals, its medium-term outlook, and its assessments of the balance of risks, including risks to the financial system that could impede the attainment of the Committee's goals.
The inflation rate over the longer run is primarily determined by monetary policy, and hence the Committee has the ability to specify a longer-run goal for inflation. The Committee judges that inflation at the rate of 2 percent, as measured by the annual change in the price index for personal consumption expenditures, is most consistent over the longer run with the Federal Reserve's statutory mandate. Communicating this inflation goal clearly to the public helps keep longer-term inflation expectations firmly anchored, thereby fostering price stability and moderate long-term interest rates and enhancing the Committee's ability to promote maximum employment in the face of significant economic disturbances.
The maximum level of employment is largely determined by nonmonetary factors that affect the structure and dynamics of the labor market. These factors may change over time and may not be directly measurable. Consequently, it would not be appropriate to specify a fixed goal for employment; rather, the Committee's policy decisions must be informed by assessments of the maximum level of employment, recognizing that such assessments are necessarily uncertain and subject to revision. The Committee considers a wide range of indicators in making these assessments. Information about Committee participants' estimates of the longer-run normal rates of output growth and unemployment is published four times per year in the FOMC's Summary of Economic Projections. For example, in the most recent projections, FOMC participants' estimates of the longer-run normal rate of unemployment had a central tendency of 5.2 percent to 6.0 percent, unchanged from one year ago but substantially higher than the corresponding interval several years earlier.
In setting monetary policy, the Committee seeks to mitigate deviations of inflation from its longer-run goal and deviations of employment from the Committee's assessments of its maximum level. These objectives are generally complementary. However, under circumstances in which the Committee judges that the objectives are not complementary, it follows a balanced approach in promoting them, taking into account the magnitude of the deviations and the potentially different time horizons over which employment and inflation are projected to return to levels judged consistent with its mandate.
The Committee intends to reaffirm these principles and to make adjustments as appropriate at its annual organizational meeting each January.
Domestic Developments
Real economic activity continued to increase at a moderate pace in the first quarter of 2013, though available indicators suggest that the pace of economic growth was somewhat slower in the second quarter. Federal fiscal policy is imposing a substantial drag on economic growth this year, and subdued growth in foreign economies continues to weigh on export demand. However, some other headwinds have diminished, and interest rates, despite recent increases, have generally remained low by historical standards, importantly due to the ongoing monetary accommodation provided by the Federal Open Market Committee (FOMC). A sustained housing market recovery appears to be under way, and, despite the increase in taxes earlier this year, consumption growth is estimated to have held up reasonably well, supported by higher equity and home prices, more-upbeat consumer sentiment, and the improving jobs situation. Payroll employment has continued to rise at a moderate pace, and various measures of underutilization in labor markets have improved further. But, at 7-1/2 percent in June, the unemployment rate was still well above levels prevailing prior to the recent recession. Meanwhile, consumer price inflation has slowed further this year, in part because of falling energy and import prices and other factors that are expected to prove transitory, and it remains below the FOMC's longer-run objective of 2 percent. Survey measures of longer-term inflation expectations have remained in the fairly narrow ranges seen over the past several years. Real economic activity continued to increase at a moderate pace in the first quarter of 2013, though available indicators suggest that the pace of economic growth was somewhat slower in the second quarter. Federal fiscal policy is imposing a substantial drag on economic growth this year, and subdued growth in foreign economies continues to weigh on export demand. However, some other headwinds have diminished, and interest rates, despite recent increases, have generally remained low by historical standards, importantly due to the ongoing monetary accommodation provided by the Federal Open Market Committee (FOMC). A sustained housing market recovery appears to be under way, and, despite the increase in taxes earlier this year, consumption growth is estimated to have held up reasonably well, supported by higher equity and home prices, more-upbeat consumer sentiment, and the improving jobs situation. Payroll employment has continued to rise at a moderate pace, and various measures of underutilization in labor markets have improved further. But, at 7-1/2 percent in June, the unemployment rate was still well above levels prevailing prior to the recent recession. Meanwhile, consumer price inflation has slowed further this year, in part because of falling energy and import prices and other factors that are expected to prove transitory, and it remains below the FOMC's longer-run objective of 2 percent. Survey measures of longer-term inflation expectations have remained in the fairly narrow ranges seen over the past several years.
Domestic Developments
Economic growth continued at a moderate pace early this year
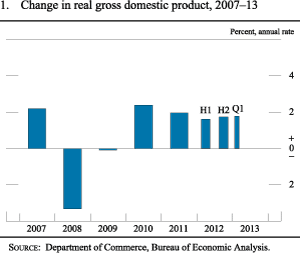
Output appears to have risen further in the first half of 2013 despite the substantial drag on economic growth from federal fiscal policy this year and the restraint on export demand from subdued foreign growth. Real gross domestic product (GDP) increased at an estimated annual rate of 1-3/4 percent in the first quarter of the year (figure 1), the same as the average pace in 2012, though available indicators point at present to a somewhat smaller gain in the second quarter. Economic activity so far this year has been supported by the continued expansion in demand by U.S. households and businesses, including what appears to be a sustained recovery in the housing market. Private demand has been bolstered by the historically low interest rates and rising prices of houses and other assets, partly associated with the FOMC's continued policy accommodation.
Figure 1. Change in Real Gross Domestic Product, 2007-13
Source: Department of Commerce, Bureau of Economic Analysis.
In addition, some of the other headwinds that have held back the economy in recent years have dissipated further. Risks of heightened financial stresses in Europe appear to have diminished somewhat, consumer confidence has improved noticeably, and credit conditions in the United States generally have eased. Nonetheless, tight credit conditions for some households are still likely restraining residential investment and consumer spending, and uncertainty about the foreign outlook continues to represent a downside risk for U.S. financial markets and for sales abroad.
Conditions in the labor market have continued to improve . . .
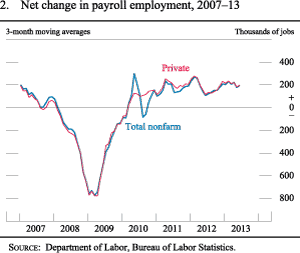
The labor market has continued to improve gradually. Gains in payroll employment averaged about 200,000 jobs per month over the first half of 2013, slightly above the average increase in each of the previous two years (figure 2). The combination of this year's output and employment increases imply that gains in labor productivity have remained slow. According to the latest published data, output per hour in the nonfarm business sector rose at an annual rate of only 1/2 percent in the first quarter of 2013, similar to its average pace in both 2011 and 2012 (figure 3).
Figure 2. Net Change in Payroll Employment, 2007-13
Source: Department of Labor, Bureau of Labor Statistics.
Figure 3. Change in Output per Hour, 1948-2013
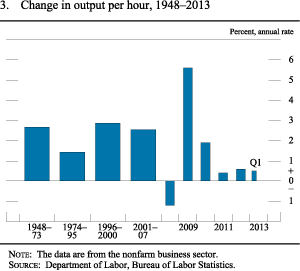
The data are from the nonfarm business sector. In bar charts, except as noted, the change for a given period is measured to its final quarter from the final quarter of the preceding period.
Source: Department of Labor, Bureau of Labor Statistics.
Meanwhile, the unemployment rate declined to 7-1/2 percent in the second quarter of this year from around 8-1/4 percent a year earlier. A variety of alternative, broader measures of labor force underutilization have also improved over the past year, roughly in line with the official unemployment rate (figure 4).
Figure 4. Measures of Labor Underutilization, 2001-13
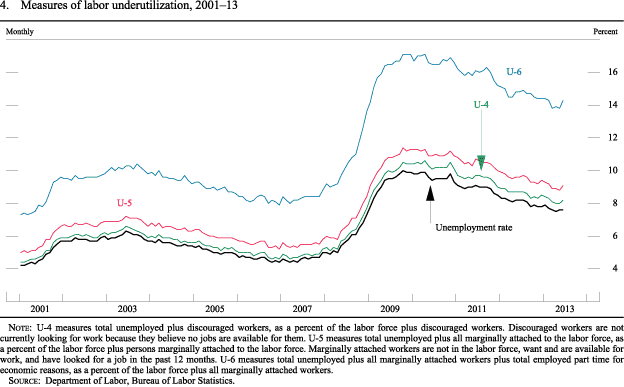
U-4 measures total unemployed plus discouraged workers, as a percent of the labor force plus discouraged workers. Discouraged workers are not currently looking for work because they believe no jobs are available for them. U-5 measures total unemployed plus all marginally attached to the labor force, as a percent of the labor force plus persons marginally attached to the labor force. Marginally attached workers are not in the labor force, want and are available for work, and have looked for a job in the past 12 months. U-6 measures total unemployed plus all marginally attached workers plus total employed part time for economic reasons, as a percent of the labor force plus all marginally attached workers.
Source: Department of Labor, Bureau of Labor Statistics.
While the unemployment rate and total payroll employment have improved further, the labor force participation rate has continued to decline, on balance. As a result, the employment-population ratio, a measure that combines the unemployment rate and labor force participation rate, has changed little so far this year. To an important extent, the decline in the participation rate likely reflects changing demographics--most notably the increasing share in the population of older persons, who have lower-than-average participation rates--that would have occurred regardless of the strength of the labor market. However, it is also likely that some of the decline in the participation rate reflects an increase in the number of workers who have stopped looking for work because of poor job prospects.1
. . . but considerable slack in labor markets remains . . .
Although labor market conditions have improved moderately so far this year, the job market remains weak overall. The unemployment rate and other measures of labor underutilization are still well above their pre-recession levels, despite payroll employment having now expanded by nearly 7 million jobs since its recent trough and the unemployment rate having fallen 2-1/2 percentage points since its peak. Moreover, unemployment has been unusually concentrated among the long-term unemployed; in June, the fraction of the unemployed who had been out of work for more than six months remained greater than one-third, although this share has continued to edge down (figure 5). In addition, last month, 8 million people, or 5 percent of the workforce, were working part time because they were unable to find full-time work due to economic conditions.
Figure 5. Long-Term Unemployed, 1979-2013
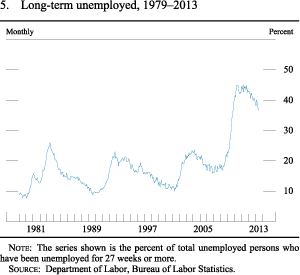
The series shown is the percent of total unemployed persons who have been unemployed for 27 weeks or more.
Source: Department of Labor, Bureau of Labor Statistics.
. . . and gains in compensation have been slow
Increases in hourly compensation continue to be restrained by the weak condition of the labor market. The 12-month change in the employment cost index for private industry workers, which measures both wages and the cost to employers of providing benefits, has remained close to 2 percent throughout most of the recovery (figure 6). Compensation per hour in the nonfarm business sector--a measure derived from the labor compensation data in the national income and product accounts--rose 2 percent over the year ending in the first quarter of 2013. Similarly, average hourly earnings for all employees--the timeliest measure of wage developments--increased 2-1/4 percent in nominal terms over the 12 months ending in June. Even with relatively slow productivity gains, the change in unit labor costs faced by firms--an estimate of the extent to which nominal hourly compensation rises in excess of labor productivity--has remained subdued.
Figure 6. Measures of Change in Hourly Compensation, 2003-13
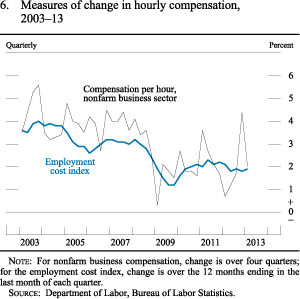
For nonfarm business compensation, change is over four quarters; for the employment cost index, change is over the 12 months ending in the last month of each quarter.
Source: Department of Labor, Bureau of Labor Statistics.
Consumer price inflation has been especially low . . .
The price index for personal consumption expenditures (PCE) increased at an annual rate of just 1/2 percent over the first five months of the year, down from a rise of 1-1/2 percent over 2012 and below the FOMC's long-run objective of 2 percent (figure 7). The very low rate of inflation so far this year partly reflects declines in consumer energy prices, but price inflation for other consumer goods and services has also been subdued. Consumer food prices have remained largely unchanged so far this year, and consumer prices excluding food and energy increased at an annual rate of 1 percent in the first five months of this year after rising 1-1/2 percent over 2012. With wages growing slowly and materials prices flat or moving downward, firms have generally not faced cost pressures that they might otherwise try to pass on.
Figure 7. Change in the Chain-Type Price Index for Personal Consumption Expenditures, 2007-13
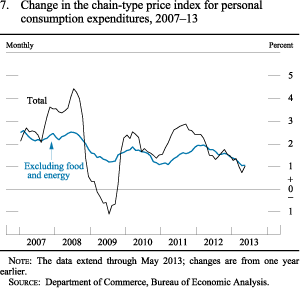
The data extend through May 2013; changes are from one year earlier.
Source: Department of Commerce, Bureau of Economic Analysis.
. . . as some transitory factors weighed on prices . . .
In addition to the decline in energy prices, this year's especially low inflation reflects, in part, other special factors that are expected to be transitory. Notably, increases in both medical services prices and the nonmarket component of PCE prices have been unusually low. While the average rate of medical-price inflation as measured by the PCE index has been considerably lower during the past few years than it was earlier, the increase over the first five months of 2013--at below 1/2 percent--has been extraordinarily muted, largely reflecting the effects on medical services prices of cuts in Medicare reimbursements associated with federal budget sequestration. (In contrast, medical services prices in the consumer price index (CPI), which exclude most Medicare payments, have risen at an annual rate of nearly 2 percent so far this year.) Because medical services have a relatively large weight in PCE expenditures (as the PCE price index reflects payments by all payers, not just out-of-pocket expenses as in the CPI), price changes in this component of spending can have a sizable effect on top-line PCE inflation.
The nonmarket PCE price index covers spending components for which market prices are not observed, such as financial services rendered without explicit charge; as a result, the Bureau of Economic Analysis imputes prices for those items. Overall, this nonmarket index declined early this year before moving up again in recent months; however, these prices tend to be volatile and appear to contain little signal for future inflation.
. . . and as oil and other commodity prices declined . . .
Global oil prices have come down, on net, from their February peak of nearly $120 per barrel, though in recent weeks they have increased somewhat from their spring lows to almost $110 per barrel (figure 8). Tensions in the Middle East have likely continued to put upward pressures on crude oil prices, but those pressures have been mitigated by concerns about the strength of oil demand in China and the rest of emerging Asia and by rising oil production in North America. Nonfuel commodity prices have eased since the beginning of the year, also reflecting slowing economic growth in emerging Asia. Notably, the price of iron ore, widely viewed as an indicator of Chinese demand for commodities, has fallen roughly 20 percent since early January. Along with falling commodity prices, prices of non-oil imported goods declined in the first half of 2013, also likely holding down domestic price increases this year.
Figure 8. Prices of Oil and Nonfuel Commodities, 2008-13
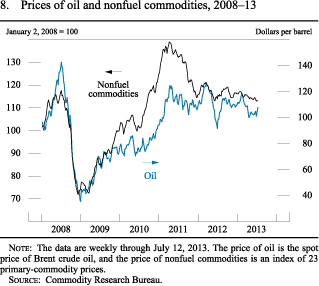
The data are weekly through July 12, 2013. The price of oil is the spot price of Brent crude oil, and the price of nonfuel commodities is an index of 23 primary-commodity prices.
Source: Commodity Research Bureau.
. . . but longer-term inflation expectations remained in their historical range
The Federal Reserve monitors the public's expectations of inflation, in part because these expectations may influence wage- and price-setting behavior and thus actual inflation. Survey-based measures of longer-term inflation expectations have changed little, on net, so far this year. Median expected inflation over the next 5 to 10 years, as reported in the Thomson Reuters/University of Michigan Surveys of Consumers (Michigan survey), was 2.9 percent in early July, within the narrow range of the past decade (figure 9).2 In the Survey of Professional Forecasters, conducted by the Federal Reserve Bank of Philadelphia, the median expectation for the increase in the PCE price index over the next 10 years was 2 percent in the second quarter of this year, similar to its level in recent years.
Figure 9. Median Inflation Expectations, 2001-13
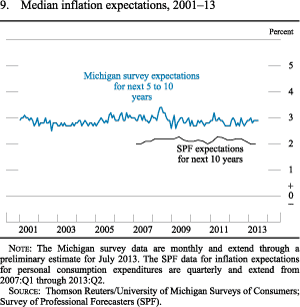
The Michigan survey data are monthly and extend through a preliminary estimate for July 2013.
Source: Thomson Reuters/University of Michigan Surveys of Consumers.
Measures of medium- and longer-term inflation compensation derived from the differences between yields on nominal and inflation-protected Treasury securities have declined between 1/4 and 1/2 percentage point so far this year (figure 10). Nonetheless, these measures of inflation compensation also remain within their respective ranges observed over the past several years, as the recent declines reversed the rise over the second half of last year. In general, movements in inflation compensation can reflect not only market participants' expectations of future inflation but also changes in investor risk aversion and fluctuations in the relative liquidity of nominal versus inflation-protected securities; the recent declines in inflation compensation may have been amplified by a reduction in demand for Treasury inflation-protected securities amid increased volatility in fixed-income markets.
Figure 10. Inflation Compensation, 2001-13
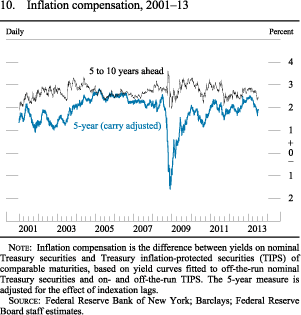
The data are daily and extend through July 12, 2013. Inflation compensation is the difference between yields on nominal Treasury securities and Treasury inflation-protected securities (TIPS) of comparable maturities, based on yield curves fitted to off-the-run nominal Treasury securities and on- and off-the-run TIPS. The 5-year measure is adjusted for the effect of indexation lags.
Source: Federal Reserve Bank of New York; Barclays; Federal Reserve Board staff estimates.
Fiscal consolidation has quickened, leading to stronger headwinds but smaller deficits
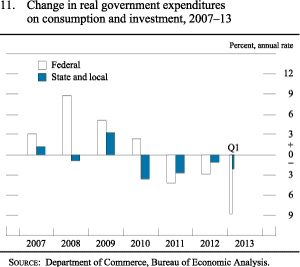
Fiscal policy at the federal level has tightened significantly this year. As discussed in the box "Economic Effects of Federal Fiscal Policy," fiscal policy changes--including the expiration of the payroll tax cut, the enactment of other tax increases, the effects of the budget caps on discretionary spending, the onset of the sequestration, and the declines in defense spending for overseas military operations--are estimated, collectively, to be exerting a substantial drag on economic activity this year. Even prior to the bulk of the spending cuts associated with the sequestration that started in March, total real federal purchases contracted at an annual rate of nearly 9 percent in the first quarter, reflecting primarily a significant decline in defense spending (figure 11). The sequestration will induce further reductions in real federal expenditures over the next few quarters. For example, many federal agencies have announced plans to furlough workers, especially in the third quarter. However, considerable uncertainty continues to surround the timing of these effects.
Figure 11. Change in Real Government Expenditures on Consumption and Investment, 2007-13
Source: Department of Commerce, Bureau of Economic Analysis.
These fiscal policy changes--along with the ongoing economic recovery and positive net payments to the Treasury by Fannie Mae and Freddie Mac--have resulted in a narrower federal deficit this year. Nominal outlays have declined substantially as a share of GDP since their peak during the previous recession, and tax receipts have moved up to about 17 percent of GDP, their highest level since the recession (figure 12). As a result, the deficit in the federal unified budget fell to about $500 billion over the first nine months of the current fiscal year, almost $400 billion less than over the same period a year earlier. Accordingly, the Congressional Budget Office projects that the budget deficit for fiscal year 2013 as a whole will be 4 percent of GDP, markedly narrower than the deficit of 7 percent of GDP in fiscal 2012. In addition, as shown in box figure A, the deficit is projected to narrow further over the next couple of years in light of ongoing policy actions and continued improvement in the economy. Despite the substantial decline in the deficit, federal debt held by the public has continued to rise and stood at 75 percent of nominal GDP in the first quarter of 2013 (figure 13).
Figure 12. Federal Receipts and Expenditures, 1995-2013
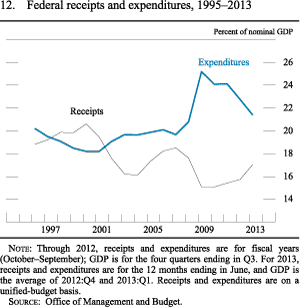
Through 2012, receipts and expenditures are for fiscal years (October-September); GDP is for the four quarters ending in Q3. For 2013, receipts and expenditures are for the 12 months ending in June, and GDP is the average of 2012:Q4 and 2013:Q1. Receipts and expenditures are on a unified-budget basis.
Source: Office of Management and Budget.
Figure 13. Federal Government Debt Held by the Public, 1963-2013
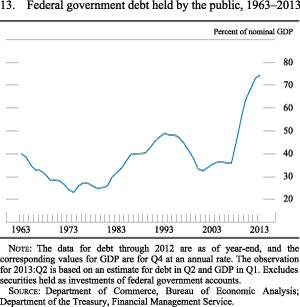
The data for debt through 2012 are as of year-end, and the corresponding values for GDP are for Q4 at an annual rate. The observation for 2013:Q2 is based on an estimate for debt in Q2 and GDP in Q1. Excludes securities held as investments of federal government accounts.
Source: Department of Commerce, Bureau of Economic Analysis; Department of the Treasury, Financial Management Service.
At the state and local level as well, the strengthening economy has helped foster a gradual improvement in the budget situations of most jurisdictions. In the first quarter of 2013, state tax receipts came in 9 percent higher than a year earlier. (Some of the recent strength in receipts, though, likely reflects tax payments on income that was shifted into 2012 in anticipation of higher federal tax rates this year.) Consistent with improving sector finances, states and municipalities are no longer reducing their workforces; employment in the nonfederal government sector edged up over the first half of the year after contracting only slightly in 2012. However, construction expenditures by these governments have declined significantly further this year. In all, real government purchases at the state and local level decreased in the first quarter and have imposed a drag on the pace of economic growth so far this year.
Economic Effects of Federal Fiscal Policy
Federal fiscal policy has had important effects on the pace of economic growth in recent years. One useful indicator of the stance of fiscal policy is the structural component of the federal budget deficit. The structural deficit excludes the cyclical part of the deficit--that is, changes in government revenues and expenditures that occur automatically over the business cycle. (It also excludes the budgetary effects of financial stabilization programs. 1) Changes in the structural deficit mainly result from fiscal policy actions: Expansionary fiscal policies that can boost near-term economic growth generate increases in the structural deficit, whereas contractionary policies that can temporarily restrain growth generate reductions in the structural deficit.
The evolution of one measure of the structural deficit is shown by the blue line in figure A. 2 During the recession and early in the recovery, federal fiscal policy was quite expansionary, as indicated by the widening of the structural deficit from 1-1/4 percent of gross domestic product (GDP) in fiscal year 2007 to 7 percent in fiscal 2010. The tax cuts and federal spending increases put in place by the Economic Stimulus Act of 2008; the American Recovery and Reinvestment Act of 2009; and the Tax Relief, Unemployment Insurance Reauthorization, and Job Creation Act of 2010 were the primary policy changes contributing to the increase in the structural deficit over this period. 3 In addition, the so-called automatic stabilizers caused the total deficit to be wider than the structural deficit. Starting in 2011, however, fiscal policy transitioned from expansionary to contractionary as the structural deficit began to narrow. The narrowing intensified somewhat last year as the structural deficit decreased from 6-1/4 percent of GDP in 2011 to 4-1/2 percent of GDP in 2012: As some temporary stimulus-related policies expired, federal policymakers shifted to deficit-reduction efforts with the enactment of the Budget Control Act of 2011, and spending on overseas military operations continued to decrease.
Accessible Version of Figure A
This year, the structural deficit is expected to decline a further 2-1/4 percent of GDP. This large decrease reflects the expiration of the temporary payroll tax cut and the enactment of some income tax increases, as well as significant restraint on government expenditures from the budget caps on discretionary spending specified in the Budget Control Act, the onset of the spending sequestration, and further declines in defense spending for overseas operations. The Congressional Budget Office estimated that the deficit-reduction policies in current law generating the 2-1/4 percentage point narrowing in the structural deficit will also restrain the pace of real GDP growth by 1-1/2 percentage points this calendar year, relative to what it would have been otherwise. 4 Under current law, fiscal policy is slated during the next couple of years to continue restraining economic growth, albeit to a diminishing extent compared with the current year, as the structural deficit shrinks further but at a slowing pace.
Despite the substantial near-term narrowing of the structural deficit, the federal government continues to face significant longer-term fiscal pressures. Indeed, under current policies, the structural deficit is projected to begin rising again later in this decade, in large part reflecting the budgetary effects of population aging and rising health-care costs, along with mounting debt service payments.
Footnotes
1. Financial stabilization programs include the Troubled Asset Relief Program (TARP), the conservatorship of Fannie Mae and Freddie Mac, and deposit insurance. These programs are excluded from the structural deficit because, although the programs helped stabilize financial markets and alleviate the crisis, neither their budgetary nor their economic effects are well captured in the deficit figures, owing in part to the accounting procedures used to score these programs in the budget. For example, in the case of the TARP, the budget scores the estimated net subsidy cost of the program (adjusted for market risk) as an outlay. Reassessments of the subsidy cost have led to large fluctuations in TARP-related outlays from year to year that do not reflect changes in policy.
2. The structural deficit used here is constructed based on estimates by the Congressional Budget Office. For estimates of the cyclical component of the deficit, see Congressional Budget Office (2013), The Effects of Automatic Stabilizers on the Federal Budget as of 2013 (Washington: CBO, March), available at www.cbo.gov/publication/43977. For projections of the total deficit, and of transactions related to financial stabilization programs, for fiscal years 2013-18, see Congressional Budget Office (2013), Updated Budget Projections: Fiscal Years 2013 to 2023 (Washington: CBO, May), available at www.cbo.gov/publication/44172.
3. Several supplemental appropriations bills enacted during this period also contributed to the increase in the structural deficit.
4. See Congressional Budget Office (2013), The Budget and Economic Outlook: Fiscal Years 2013 to 2023 (Washington: CBO, February), available at www.cbo.gov/publication/43907.
The housing market recovery continued to gain traction . . .
Activity in the housing market has continued to strengthen, supported by low mortgage rates, sustained job gains, and improved sentiment on the part of potential buyers. In the Michigan survey, many households report that low interest rates and house prices make it a good time to buy a home; a growing percentage of respondents also expect that house price gains will continue. Reflecting the improving demand conditions, sales of both new and existing homes have continued to move up, on net, this year. Construction of new housing units has also trended up over the past year (figure 14), contributing to solid rates of increase in real residential investment in the first half of 2013. Even so, the level of construction activity remains low by historical standards. The steep rise in mortgage interest rates since May could temper the pace of home sales and construction going forward, though the pace of purchase mortgage applications so far has shown no material signs of slowing, even as the pace of refinancing applications has tailed off sharply.
The strengthening in housing demand has occurred despite the fact that mortgage credit remains limited for borrowers without excellent credit scores or the ability to make sizable down payments. Responses to special questions in the Federal Reserve's April Senior Loan Officer Opinion Survey on Bank Lending Practices (SLOOS) suggested that some banks had actually tightened standards over the past year on some loans that are eligible for purchase by the government-sponsored enterprises and loans guaranteed by the Federal Housing Administration, specifically those to borrowers with credit scores below 620 and with low down payments. Indeed, only about 10 percent of new prime mortgage originations made this spring were reported to be associated with FICO scores below 690, compared with a quarter of originations in 2005 (figure 15).
Figure 14. Private Housing Starts, 1999-2013
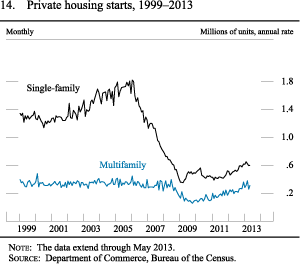
The data extend through May 2013.
Source: Department of Commerce, Bureau of the Census.
Figure 15. Credit Scores on New Prime Mortgages, 2003-13
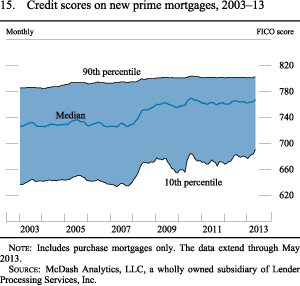
Includes purchase mortgages only. The data extend through May 2013.
Source: McDash Analytics, LLC, a wholly owned subsidiary of Lender Processing Services, Inc.
. . . as house prices rose further
House prices, as measured by several national indexes, have increased significantly further since the end of last year (figure 16). In particular, the CoreLogic repeat-sales index rose about 7 percent (not at an annual rate) over the first five months of 2013 to reach its highest level since the third quarter of 2008. Some of the largest recent gains have occurred where the housing market has been most severely depressed. Recent increases notwithstanding, house prices remain far below the peaks reached before the recession, and the national price-to-rent ratio continues to be near its long-run average. Still, the increase in house prices has helped to materially reduce the number of "underwater" mortgages and made households somewhat less likely to default on their mortgages.
Figure 16. Prices of Existing Single-Family Houses, 2002-13
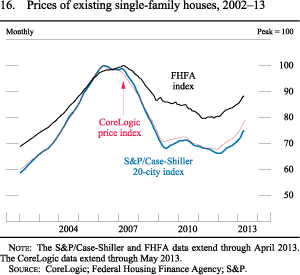
The data are monthly. The S&P/Case-Shiller and FHFA data extend through April 2013. The CoreLogic data extend through May 2013.
Source: CoreLogic; Federal Housing Finance Agency; S&P.
Mortgage interest rates increased but remained low by historical standards
Mortgage interest rates have increased significantly in the past couple of months from record lows reached earlier this year (figure 17). However, rates are still low by historical standards, reflecting in part the Federal Reserve's ongoing purchases of mortgage-backed securities (MBS) and highly accommodative overall stance of monetary policy. The spread between rates on conforming mortgages and yields on agency-guaranteed MBS has decreased slightly since the end of 2012.
Figure 17. Mortgage Interest Rate and Mortgage Refinance Index, 1990-2013
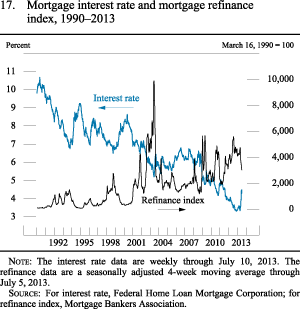
The refinance data are a seasonally adjusted 4-week moving average through July 5, 2013.
Source: Mortgage Bankers Association.
Low mortgage rates, along with rising house prices, continued to facilitate a significant pace of refinancing for most of the first half of 2013, which has helped households reduce monthly debt service payments. However, refinancing remained difficult for households without solid credit ratings and those with limited home equity. Moreover, as mortgage rates moved higher, refinancing activity began to decrease sharply in May.
Consumer spending has held up despite the drag from tax increases early this year
Real consumption expenditures rose at an annual rate of about 2 percent over the first five months of this year, about the same as in the previous two years (figure 18). These increases have occurred despite higher taxes and have been supported by several factors. The gains this year in house prices and equity values have helped households recover some of the wealth lost during the recession; indeed, the ratio of household net wealth to income is estimated to have moved up sharply in the first quarter (figure 19). In recent months, indicators of consumer sentiment have become more upbeat as well (figure 20). Furthermore, in contrast to mortgage rates, interest rates on auto loans and credit cards have changed little, on balance, since the end of 2012. With interest rates low, the household debt service ratio--the ratio of required principal and interest payments on outstanding household debt to disposable personal income--remained near historical lows (figure 21).
Figure 18. Change in Real Personal Consumption Expenditures, 2007-13
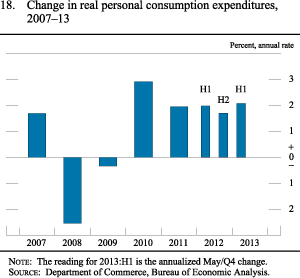
The reading for 2013:H1 is the annualized May/Q4 change.
Source: Department of Commerce, Bureau of Economic Analysis.
Figure 19. Wealth-to-Income Ratio, 1993-2013
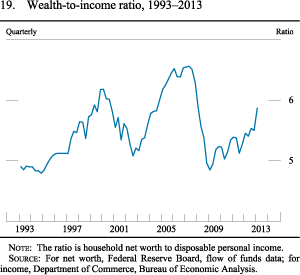
The ratio is household net worth to disposable personal income.
Source: For net worth, Federal Reserve Board, flow of funds data; for income, Department of Commerce, Bureau of Economic Analysis.
Figure 20. Consumer Sentiment Indexes, 2000-13
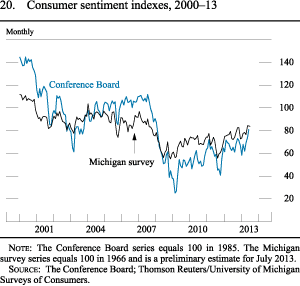
The Conference Board series equals 100 in 1985. The Michigan survey series equals 100 in 1966 and is a preliminary estimate for July 2013.
Source: The Conference Board; Thomson Reuters/University of Michigan Surveys of Consumers.
Figure 21. Household Debt Service, 1980-2013
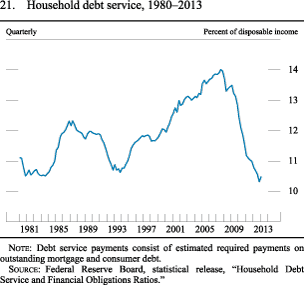
Debt service payments consist of estimated required payments on outstanding mortgage and consumer debt.
Source: Federal Reserve Board, statistical release, "Household Debt Service and Financial Obligations Ratios."
In addition, real disposable personal income has increased slightly, on balance, over the past year, as moderate gains in employment and wages have more than offset the implications for income of changes in tax policy.3 And household purchasing power has been supported so far this year by low consumer price inflation. On balance, moderate increases in spending have outpaced disposable income growth, pushing the personal saving rate down to around 3 percent in recent months, close to the level that prevailed before the recession (figure 22).
Figure 22. Personal Saving Rate, 1993-2013
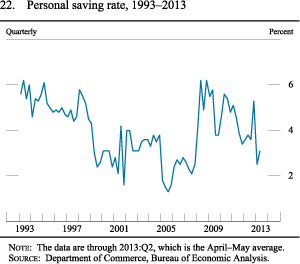
The data are through 2013:Q2, which is the April-May average.
Source: Department of Commerce, Bureau of Economic Analysis.
The financial conditions of households continued to improve slowly
Although mortgage debt continued to contract amid still-tight credit conditions for some borrowers, consumer credit expanded at an annual rate of about 6 percent in the first quarter of 2013. Student loans, the vast majority of which are guaranteed or originated by the federal government and subject to minimal underwriting criteria, are estimated to have increased rapidly and now total nearly $1 trillion, making them the largest category of consumer indebtedness outside of mortgages. Auto loans are also estimated to have increased at a robust pace. Stable collateral values and favorable conditions in the asset-backed securities market may have contributed to easier standards for such loans. In contrast, revolving consumer credit (primarily credit card lending) was little changed in the first quarter, and standards and terms on credit card loans appeared to remain tight, especially for consumers with less-than-pristine credit histories. For instance, spreads of interest rates on credit card loans over reference interest rates remained historically wide. Consequently, credit card debt extended to consumers with prime credit scores remained well below its pre-crisis levels, while debt extended to those with subprime credit scores--that is, Equifax Risk Scores below 660--continued to trend down (figure 23).
Figure 23. Credit Card Balances, 2000-13
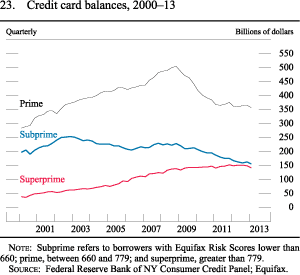
The data are quarterly and extend through 2013:Q1. Subprime refers to borrowers with Equifax Risk Scores lower than 660; prime, between 660 and 779; and superprime, greater than 779.
Source: Federal Reserve Bank of NY Consumer Credit Panel; Equifax.
According to the most recent available data, indicators of distress for most types of household debt have declined since the end of 2012. For home mortgages, for example, the fraction of current mortgages becoming 30 or more days delinquent has now reached relatively low levels as a result of strict underwriting conditions for new mortgages as well as improved conditions in housing and labor markets. Measures of late-stage mortgage delinquency, such as the inventory of properties in foreclosure, also improved but remained elevated. Delinquency rates on student loans also remained high, likely reflecting in part the lack of underwriting on the federally backed loans that make up the bulk of the student loans outstanding.
The financial conditions of nonfinancial firms continued to be strong . . .
In the first quarter, the aggregate ratio of liquid to total assets for nonfinancial firms ticked up and remained near its highest level in 20 years, while the aggregate ratio of debt to assets was still well below its average over the same period (figure 24). Strong balance sheets, in turn, have contributed to solid credit quality: Bond default rates, as of June, stayed low by historical standards, and the delinquency rate on commercial and industrial (C&I) loans continued to fall in the first quarter from already low levels. However, over the first half of the year, the volume of nonfinancial corporate bonds that were upgraded by Moody's Investors Service was less than the volume downgraded.
Figure 24. Financial Ratios for Nonfinancial Corporations, 1990-2013
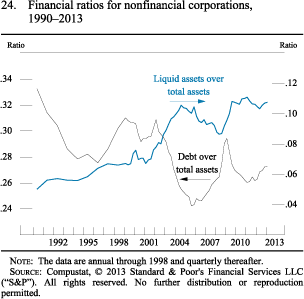
The data are annual through 1998 and quarterly thereafter.
Source: Compustat, © 2013 Standard & Poor's Financial Services LLC ("S&P"). All rights reserved. No further distribution or reproduction permitted.
. . . and corporate bond and loan issuance remained robust
With corporate credit quality strong and interest rates near historically low levels through much of the first half of 2013 (figure 25), nonfinancial firms continued to raise funds, especially using longer-duration instruments. The pace of bond issuance by both investment- and speculative-grade nonfinancial firms remained extraordinarily brisk until interest rates rose significantly in May, while nonfinancial commercial paper (CP) outstanding was little changed (figure 26). C&I loans outstanding at commercial banks in the United States continued to expand during the first half of 2013 but at a slower pace than in the second half of 2012, when firms reportedly ramped up their C&I borrowing in part to make larger-than-usual dividend and bonus payments in advance of anticipated year-end tax hikes. A relatively large fraction of respondents to the April SLOOS indicated that, over the preceding three months, they had eased standards and pricing terms for C&I loans to firms of all sizes. Meanwhile, issuance of leveraged loans extended by nonbank institutions in the syndicated loan market was very elevated (figure 27), boosted by strong investor demand for these floating-rate instruments manifested through inflows to loan mutual funds and rapid growth of newly established collateralized loan obligations. More than two-thirds of the proceeds from such syndicated loan issuance, however, were reportedly used to repay existing debt.
Figure 25. Corporate Bond Yields by Securities Rating, 1997-2013
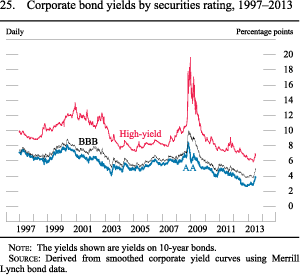
The data are daily and extend through July 12, 2013. The yields shown are yields on 10 year bonds.
Source: Derived from smoothed corporate yield curves using Merrill Lynch bond data.
Figure 26. Selected Components of Net Financing for Nonfinancial Businesses, 2006-13
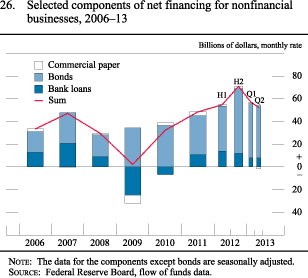
The data for the components except bonds are seasonally adjusted.
Source: Federal Reserve Board, flow of funds data.
Figure 27. Leveraged Loans Extended by Nonbank Institutions, 2006-13
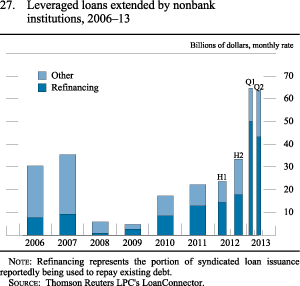
Refinancing represents the portion of syndicated loan issuance reportedly being used to repay existing debt.
Source: Thomson Reuters LPC's LoanConnector.
Borrowing conditions for small businesses improved, though demand for credit remained subdued
Some indicators of borrowing conditions for small businesses have improved since the end of 2012. According to the surveys conducted by the National Federation of Independent Business (NFIB) during the first half of 2013, the fraction of small businesses that found credit more difficult to obtain than three months prior declined on net. Recent readings from the Federal Reserve's Survey of Terms of Business Lending indicate that the spreads charged by commercial banks on newly originated C&I loans with original amounts less than $1 million--a large share of which likely consist of loans to small businesses--continued to edge down, though they remained elevated.4 However, demand for credit from small firms apparently remained subdued compared with demand from large and middle-market firms. Relatively large fractions of respondents in recent NFIB surveys indicated that they did not have any borrowing needs, and the total dollar volume of business loans with original amounts of $1 million or less outstanding at U.S. commercial banks was little changed in the first quarter.
However, business spending on capital investment has been rising at only a modest pace
Despite the large amount of business borrowing, businesses' capital investment has been rising only modestly. Real spending on equipment and software (E&S) increased at an annual rate of 4 percent in the first quarter after having risen at a similar, below-average pace in 2012 (figure 28); these increases likely reflect the tepid growth in business output over the past year. Shipments and orders of nondefense capital goods and other forward-looking indicators of business spending are consistent with further moderate gains in E&S spending in the spring and summer of this year.
Business investment in structures has also been relatively low so far this year, even apart from a sharp drop-off in expenditures on wind-power facilities following a tax-related burst of construction late last year. The level of investment in drilling and mining structures has stayed elevated, supported by high oil prices and the continued exploitation of new drilling technologies. However, investment in nonresidential buildings continues to be restrained by high vacancy rates for existing properties, low commercial real estate (CRE) prices, and tight financing conditions for new construction. Indeed, banks' holdings of construction and land development loans have contracted every quarter since the first half of 2008.
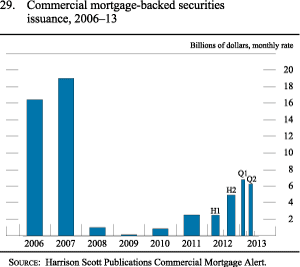
Despite weak fundamentals, conditions in markets for CRE financing appeared to loosen somewhat. A moderate fraction of banks in the April SLOOS again reported having eased their lending standards on CRE loans, while a somewhat larger fraction continued to report some increase in demand for these loans. In addition, the pace of issuance of commercial mortgage-backed securities has stepped up, on balance, this year, but it remained well below its peak reached in 2007 (figure 29).
Figure 28. Change in Real Business Fixed Investment, 2006-13
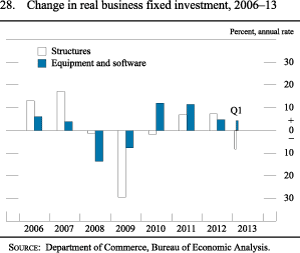
Source: Department of Commerce, Bureau of Economic Analysis.
Figure 29. Commercial Mortgage-Backed Securities Issuance, 2006-13
Source: Harrison Scott Publications Commercial Mortgage Alert.
Foreign trade has been relatively weak
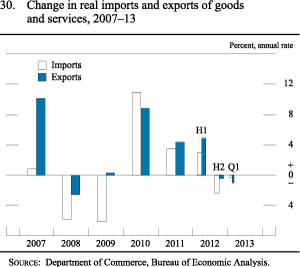
Export demand, which provided substantial support to domestic activity earlier in the recovery, has weakened since the middle of 2012, partly reflecting subdued foreign economic activity. Real exports of goods and services declined at an annual rate of 1 percent in the first quarter of 2013 (figure 30), though data for the first two months of the second quarter suggest that they rebounded. Exports to Japan have been particularly weak, but those to Canada continue to rise.
Real imports of goods and services edged down in the first quarter after falling substantially in the fourth quarter of 2012. Data for April and May suggest that imports recovered at a moderate pace in the second quarter. Although imports of non-oil goods and services rose, imports of oil declined further as U.S. oil production continued its climb of recent years.
Altogether, net exports were a neutral influence on the growth of real GDP in the first quarter of 2013, and partial data suggest that the same was the case in the second quarter.
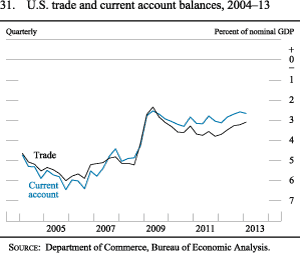
The current account deficit remained at about 2-1/2 percent of GDP in the first quarter of 2013 (figure 31), a level little changed since 2009. The current account deficit had narrowed substantially in late 2008 and early 2009 when U.S. imports dropped sharply, in part reflecting the steep decline in oil prices.
Figure 30. Change in Real Imports and Exports of Goods and Services, 2007-13
Source: Department of Commerce, Bureau of Economic Analysis.
Figure 31. U.S. Trade and Current Account Balances, 2004-13
Source: Department of Commerce, Bureau of Economic Analysis.
In the first quarter of 2013, the current account deficit continued to be financed by strong financial inflows, mostly from purchases of Treasury securities by both foreign official and foreign private investors (Figure 32). Consistent with continued improvement in market sentiment, U.S. investors made further strong purchases of foreign securities, especially equities.
Figure 32. U.S. Net Financial Inflows, 2008-13
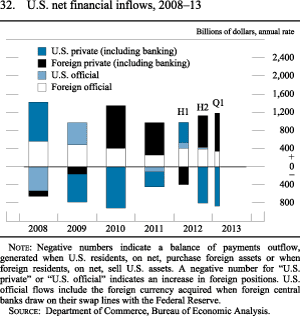
Negative numbers indicate a balance of payments outflow, generated when U.S. residents, on net, purchase foreign assets or when foreign residents, on net, sell U.S. assets. A negative number for "U.S. private" or "U.S. official" indicates an increase in foreign positions. U.S. official flows include the foreign currency acquired when foreign central banks draw on their swap lines with the Federal Reserve.
Source: Department of Commerce, Bureau of Economic Analysis.
National saving is very low
Net national saving--that is, the saving of U.S. households, businesses, and governments, net of depreciation charges--remains extremely low by historical standards (figure 33). In the first quarter of 2013, net national saving was 1 percent of nominal GDP, up from figures that averaged around zero over the past few years. As discussed earlier, the near-term federal deficit has narrowed because of fiscal policy changes and the economic recovery, and further declines in the federal budget deficit over the next few years should boost national saving somewhat. With the economy still weak and demand for investable funds limited, the low level of national saving is not constraining growth or leading to higher interest rates. However, if low levels of national saving persist over the longer run, they will likely be associated with both low rates of capital formation and heavy borrowing from abroad, limiting the rise in the standard of living for U.S. residents over time.
Figure 33. Net Saving, 1993-2013
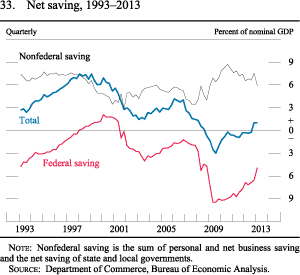
Nonfederal saving is the sum of personal and net business saving and the net saving of state and local governments.
Source: Department of Commerce, Bureau of Economic Analysis.
Financial Developments
Financial Developments
The expected path for the federal funds rate in 2014 and 2015 steepened . . .
Market-based measures of the expected future path of the federal funds rate moved higher over the first half of the year, as investors responded to somewhat better-than-expected incoming economic data and to communications from Federal Reserve officials that were seen as suggesting a tighter stance of monetary policy than had been anticipated. The modal path of the federal funds rate--that is, the values for future federal funds rates that market participants see as most likely--derived from interest rate options shifted up considerably, especially around the June FOMC meeting, suggesting that investors may now expect the target funds rate to lift off from its current range significantly earlier than they expected at the end of 2012. However, a part of this increase may have reflected a rise in term premiums associated with increased uncertainty about the monetary policy outlook. According to a survey of primary dealers conducted shortly after the June FOMC meeting by the Open Market Desk at the Federal Reserve Bank of New York, dealers' expectations of the date of liftoff have moved up one quarter since the end of last year, to the second quarter of 2015.5
. . . while yields on longer-term securities increased significantly but remained low by historical standards
Reflecting the same factors, yields on longer-term Treasury securities and agency MBS are also substantially higher now than they were at the end of last year (figures 34 and 35). The rise in longer-term yields appears to have been amplified by a pullback from duration risk as well as technical factors, including rapid changes in trading strategies and positions that had been predicated on the continuation of very low rates and volatility. On balance, yields on 5-, 10-, and 30-year nominal Treasury securities have increased between 65 and 85 basis points, on net, to 1-1/2 percent, 2-1/2 percent, and 3-3/4 percent, respectively, since the end of last year.
Yields on 30-year agency MBS increased more than those on Treasury securities, rising about 1-1/4 percentage points, on net, since the end of 2012, to about 3-1/2 percent. Agency MBS yields also rose significantly more than the yields on comparable nominal Treasury securities after adjusting for the effects of higher interest rates on the likelihood that borrowers will prepay their mortgages (the option-adjusted spread), likely reflecting investors' reassessment of the outlook for the Federal Reserve's MBS purchases as well as subsequent market dynamics.
Figure 34. Yields on Nominal Treasury Securities, 2000-13
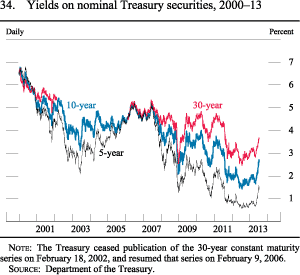
The Treasury ceased publication of the 30-year constant maturity series on February 18, 2002, and resumed that series on February 9, 2006.
Source: Department of the Treasury.
Figure 35. Yield and Spread on Agency Mortgage-Backed Securities, 2000-13
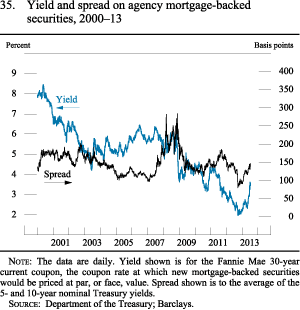
The data are daily and extend through July 12, 2013. Yield shown is for the Fannie Mae 30-year current coupon, the coupon rate at which new mortgage-backed securities would be priced at par, or face, value. Spread shown is to the average of the 5- and 10-year nominal Treasury yields.
Source: Department of the Treasury; Barclays.
Nonetheless, yields on longer-term securities continue to be low by historical standards. Those low levels reflect several factors, including subdued inflation expectations as well as still-modest economic growth prospects in the United States and other major developed economies. In addition, despite their recent rise, term premiums--the extra return investors expect to obtain from holding longer-term securities as opposed to holding and rolling over a sequence of short-term securities for the same period--remain small, reflecting both the FOMC's ongoing large-scale asset purchase program and strong demand for longer-term securities from global investors.
Indicators of market functioning in both the Treasury and agency MBS markets were generally solid over the first half of the year. In particular, the Desk's outright purchases of Treasury securities and agency MBS did not appear to have a material adverse effect on liquidity in those markets. For example, available data suggest bid-asked spreads in Treasury and agency MBS markets continued to be in line with recent averages, though some widening has been observed of late amid increased market volatility. In the Treasury market, auctions generally continued to be well received by investors. In the agency MBS market, settlement fails remained low, and implied financing rates in the "dollar roll" market--an indicator of the scarcity of agency MBS for settlement--have drifted up over the past six months, indicating reduced settlement pressures (figure 36).6
Figure 36. Dollar-Roll-Implied Financing Rates (Front Month), Fannie Mae 30-Year, 2011-13
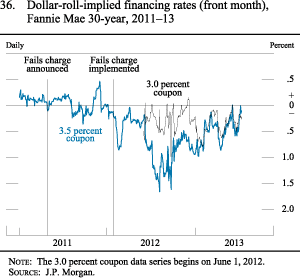
The data are daily and extend through July 12, 2013. The 3.0 percent coupon data series begins on June 1, 2012.
Source: J.P. Morgan.
Short-term funding markets continued to function well
Conditions in short-term funding markets remained good, with many money market rates having edged down from already low levels since the end of 2012 to near the bottom of the ranges they have occupied since the zero-lower-bound period began (figure 37). In the market for repurchase agreements, bid-asked spreads and haircuts for most collateral types were reportedly little changed, while rates moved down slightly, on net, for general collateral finance repurchase agreements. Despite the high level of reserve balances and the substantially reduced volume of trading in the federal funds market since 2008, the effective federal funds rate has continued to be strongly correlated with these money market rates. Rates on asset-backed commercial paper (ABCP) also fell, and spreads on ABCP with European bank sponsors have generally converged back to those on ABCP with U.S. bank sponsors. Rates on unsecured financial CP for both U.S. and European issuers have remained low, even during the temporary flare-up of concerns about European financial stability surrounding the banking problems in Cyprus, while forward measures of funding spreads have continued to be narrow by historical standards.
Figure 37. Overnight Money Market Rates, 2009-13
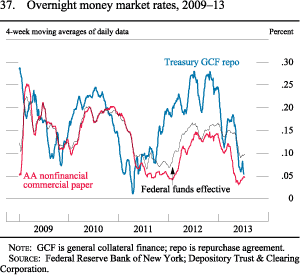
The data are 4-week moving averages of daily data and extend through July 12, 2013. GCF is general collateral finance; repo is repurchase agreement.
Source: Federal Reserve Bank of New York; Depository Trust & Clearing Corporation.
Broad equity price indexes increased further . . .
Broad equity price indexes notched substantial gains and reached record levels in nominal terms, boosted by improved market sentiment regarding the economic outlook, the FOMC's sustained highly accommodative monetary policy, and stable expectations about medium-term earnings growth (figure 38). Despite the increased volatility around the time of the June FOMC meeting, as of mid-July, broad measures of equity prices were 18 percent higher, on net, than their levels at the end of 2012. Nonetheless, the spread between the 12-month expected forward earnings-price ratio for the S&P 500 and a long-run real Treasury yield--a rough gauge of the equity risk premium--stayed very elevated by historical standards, suggesting that investors remain somewhat cautious in their attitudes toward equities (figure 39). Outside of the period surrounding the June FOMC meeting, implied volatility for the S&P 500 index, as calculated from option prices, generally remained near the bottom end of the range it has occupied since the onset of the financial crisis.
Figure 38. Equity Prices, 1996-2013
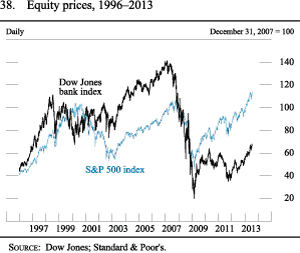
The data are daily and extend through July 12, 2013.
Source: Dow Jones; Standard & Poor's.
Figure 39. Market-Implied Equity Premium, 1995-2013
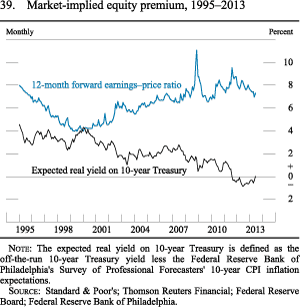
The data are monthly and extend through June 2013. The expected real yield on 10-year Treasury is defined as the off-the-run 10-year Treasury yield less the Federal Reserve Bank of Philadelphia's Survey of Professional Forecasters' 10 year CPI inflation expectations.
Source: Standard & Poor's; Thomson Reuters Financial; Federal Reserve Board; Federal Reserve Bank of Philadelphia.
. . . and market sentiment toward financial institutions continued to strengthen as credit quality improved
On average, the equity prices of domestic financial institutions have outperformed broader equity indexes since the end of last year. Improved investor sentiment toward the financial sector reportedly was driven by perceptions of reduced downside risk in the housing market as well as expectations of continued improvements in credit quality and of increased net interest margins as the yield curve steepened over the past few months. However, prices of real estate investment trust (REIT) shares underperformed, especially after interest rates started rising in May, partially reflecting a broader shift on the part of investors from income-oriented shares toward more cyclically sensitive issues. Shares of mortgage REITs were particularly affected by the sharp rise in Treasury and agency MBS yields.
Equity prices for large domestic banks have increased 24 percent since the end of 2012 (figure 38). However, they have yet to fully recover from the very depressed levels reached during the financial crisis. Standard measures of the profitability of bank holding companies (BHCs) edged down in the first quarter but remained in the upper end of their subdued post-crisis range. BHC profits were held down by modest noninterest income and a further narrowing of net interest margins. By contrast, profits were supported by additional reductions in noninterest expenses and decreases in provisioning for loan losses, as indicators of credit quality improved further in every major asset class. Banks' allowances for loan and lease losses continued to trend down as charge-offs of bad loans once again exceeded provisions in the first quarter (figure 40).
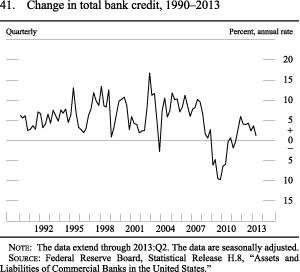
Risk-based capital ratios (based on current Basel I definitions) of the 25 largest BHCs decreased in the first quarter because of the adoption of the new market risk capital rule, while risk-based capital ratios at smaller BHCs edged up.7 Nonetheless, BHCs of all sizes remained well capitalized by historical standards as they prepare for the transition to stricter Basel III requirements (see the box "Developments Related to Financial Stability"). Aggregate credit provided by commercial banks continued to increase in the first half of 2013 (figure 41).
Figure 40. Provisions and Charge-Offs, 2005-13
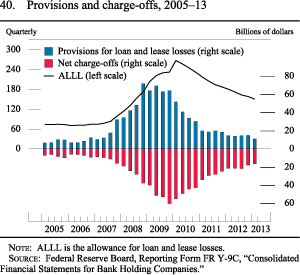
ALLL is the allowance for loan and lease losses.
Source: Federal Reserve Board, Reporting Form FR Y-9C, "Consolidated Financial Statements for Bank Holding Companies."
Figure 41. Change in Total Bank Credit, 1990-2013
The data extend through 2013:Q2. The data are seasonally adjusted.
Source: Federal Reserve Board, Statistical Release H.8, "Assets and Liabilities of Commercial Banks in the United States."
Developments Related to Financial Stability
As highlighted in previous Monetary Policy Reports, the Federal Reserve has devoted increased resources to monitoring potential risks to financial stability. In addition to new regulations to strengthen the financial system, comprehensive monitoring is necessary because the system will evolve in response to new regulations, and because market participants' risk tolerance and perceptions tend to vary with economic and financial conditions. The Federal Reserve's increased monitoring efforts focus on identifying financial vulnerabilities--features of the financial system that can transmit and amplify the effects of unforeseen adverse events. For example, vulnerabilities can arise through excess leverage, through excess maturity transformation--that is, financing long-term assets with short-term debts--and through the complexity and interconnectedness of financial institutions. In recent years, a stronger regulatory framework and an enhanced focus by the private sector on potential risks have contributed to significant reductions in vulnerabilities and a more resilient U.S. financial system. However, important challenges remain, and the Federal Reserve will monitor developments regarding ongoing and emerging financial vulnerabilities.
The financial strength of the banking sector continued to improve last year. Bank holding companies (BHCs) increased the proportion of common equity in their funding base, continuing a trend of recent years. For example, the ratio of tier 1 common equity to risk-weighted assets among the firms participating in the recent Comprehensive Capital Analysis and Review and the stress tests mandated by the Dodd-Frank Wall Street Reform and Consumer Protection Act of 2010 (Dodd-Frank Act) has more than doubled since the first similar stress test in 2009 and totaled 11.3 percent at the beginning of this year. 1 These stress tests are regulatory tools that the Federal Reserve uses to help ensure that financial institutions have robust capital-planning processes and are able to maintain adequate capital even following an extended period of adverse economic conditions. Indeed, capital ratios maintained under the hypothetical "severely adverse" macroeconomic scenario specified in the most recent stress tests suggest that BHCs have become more resilient to possible adverse macroeconomic shocks.
The banking system has also improved its liquidity position relative to pre-crisis levels. For example, large BHCs' holdings of cash and high-quality liquid securities have risen from less than 16 percent of total assets in 2007 to 24 percent in the first quarter of 2013. Further, firms have sharply reduced their dependence on wholesale short-term funding, which proved highly unreliable during the crisis.
In addition, the credit risk of banks' assets has generally declined as banks have tightened lending standards and as some borrowers--both households and nonfinancial firms--have strengthened their financial positions by refinancing their debt at lower interest rates. This improvement has also been aided by the rise in house prices and equity values amid the recovery in economic activity. Consistent with all of these improvements, premiums on BHC credit default swaps (CDS) have fallen by nearly one-half from their 2009 levels. Similarly, systemic risk measures for these firms--which assess the amount of financial stress that would be realized in the event of a sizable financial shock based on CDS premiums, stock prices, and correlations--have declined substantially.
The significant amount of funding channeled through the "shadow banking" sector contributed to the financial system's fragility before the financial crisis, largely because of that sector's reliance on wholesale short-term funds to finance longer-term assets. Activity in this sector contracted significantly in the wake of the crisis and has expanded only moderately since the post-crisis trough. The risks inherent in some forms of shadow banking have been addressed through tighter banking regulations that require more recognition of exposures to off-balance-sheet vehicles, such as asset-backed commercial paper conduits. Nonetheless, significant vulnerabilities associated with wholesale short-term funding remain.
While the extended period of low interest rates has contributed to improved economic conditions and increased resiliency in the financial sector, it could also lead investors to "reach for yield" through excessive leverage, duration risk, credit risk, or other forms of risk-taking. There are signs that the low level of interest rates, as well as improved investor sentiment, has contributed to a modest pickup in leverage and maturity transformation in some markets. However, the recent rise in interest rates and volatility may have led some investors to reevaluate their risk-taking behavior.
Securitization markets grew rapidly over the past year and a half, as investors reportedly increased their exposure to structured finance products in order to boost returns. New U.S. securitization issuance excluding agency residential mortgage-backed securities (MBS) was roughly $500 billion (at an annual rate) in the first quarter, up sharply from the level a year ago but still well below the peak of over $2 trillion reached before the crisis. Collateralized loan obligations and commercial mortgage-backed securities (CMBS) accounted for a substantial part of the increase. Dealer responses in the June Senior Credit Officer Opinion Survey on Dealer Financing Terms indicate that demand for funding of securitized products, such as non-agency residential MBS and CMBS, had increased, suggesting some investments were being funded with short-term debt. 2
In addition, low Treasury yields likely boosted the pace of investment in corporate bond and loan funds and contributed to sizable issuance of high-yield bonds and syndicated leveraged loans this year. However, spreads of yields on corporate bonds relative to those on comparable-maturity Treasury securities were not unusually narrow by historical standards, and purchases generally do not appear to have been financed with leverage or short-term funding, which should limit the risk of a disorderly unwind. As Treasury yields have risen since the beginning of May, corporate bond funds have experienced substantial outflows and bond yields have risen, although spreads over Treasury securities have posted small mixed changes. For syndicated leveraged loans, underwriting standards, such as the number of covenants and required debt-to-earnings multiples, have been easing, and continued flows to loan funds suggest pressures in underwriting may continue. Banking supervisors are currently working on implementing new supervisory guidance on leveraged lending practices, which should help mitigate the potential for a buildup of vulnerabilities. 3
Agency mortgage real estate investment trusts (agency REITs) are another area where investors have displayed a willingness to take on risk to achieve higher returns. Agency REITs purchase agency MBS, funded largely by relatively short-term repurchase agreements, and thus combine high leverage with extensive maturity transformation, creating the potential to disrupt MBS markets if, for instance, rates were to rise sharply. Amid the recent increase in interest rates and widening of MBS spreads, stock prices of agency REITs have fallen about 20 percent, and some of these firms have reportedly sold assets to offset the resulting increase in their leverage. To date, sales by these agency REITs and other funds with similar positions reportedly have amplified the initial rise in rates and spreads, but market functioning has not been impaired.
At commercial banking firms, the low interest rate environment in recent years has been pressuring net interest margins, and some firms appear to have extended the duration of their securities holdings to boost profits. Supervisors have been working with banks on interest rate risk-management practices to ensure that the banks' practices comply with the interagency advisory that was issued in 2010. 4Improved practices should make the banks more resilient to unexpected interest rate shocks. The low interest rates also appear to be pressuring profits among life insurance companies, and some insurers have added marginally more credit and liquidity risk to their asset portfolios.
The Federal Reserve has continued to make progress on financial reform. The Federal Reserve recently finalized its proposal to implement the Basel III capital requirements. The final rule promotes a stronger banking system by increasing the quantity and quality of required regulatory capital, which is accomplished by setting a new tier 1 common equity capital ratio of 4.5 percent of risk-weighted assets (RWA), a capital conservation buffer of 2.5 percent of RWA, and strict eligibility criteria for regulatory capital instruments. In addition, the rule contains a supplementary minimum leverage ratio and a countercyclical capital buffer for large and internationally active banking organizations. Furthermore, the Federal Reserve is working this year toward finalization of additional rules that would implement sections 165 and 166 of the Dodd-Frank Act, a broad set of enhanced prudential standards for BHCs with total assets of $50 billion or more and systemically important nonbank financial companies designated by the Financial Stability Oversight Council (FSOC). The rules relating to resolution planning and stress testing are already completed, and the Federal Reserve is working to finalize rules for capital requirements, liquidity requirements, single-counterparty credit limits, an early remediation regime, and risk-management requirements. Finally, the Federal Reserve is preparing to regulate and supervise systemically important nonbank financial firms. Recently, the FSOC designated two nonbank financial firms and it has proposed the designation of a third firm, which has requested a hearing before the council. 5
Footnotes
1. Information on these stress tests and the Comprehensive Capital Analysis and Review is available on the Federal Reserve Board's website at www.federalreserve.gov/bankinforeg/stress-tests-capital-planning.htm.
2. The survey is available on the Federal Reserve Board's website at www.federalreserve.gov/econresdata/releases/scoos.htm.
3. See Board of Governors of the Federal Reserve System, Division of Banking Supervision and Regulation (2013), "Interagency Guidance on Leveraged Lending," Supervision and Regulation Letter SR 13-3 (March 21), www.federalreserve.gov/bankinforeg/srletters/sr1303.htm.
4. See Board of Governors of the Federal Reserve System, Division of Banking Supervision and Regulation (2010), "Interagency Advisory on Interest Rate Risk," Supervision and Regulation Letter SR 10-1 (January 11), www.federalreserve.gov/boarddocs/srletters/2010/sr1001.htm.
5. U.S. Department of the Treasury (2013), "Financial Stability Oversight Council Makes First Nonbank Financial Company Designations to Address Potential Threats to Financial Stability," press release, July 9, www.treasury.gov/press-center/press-releases/Pages/jl2004.aspx.
M2 rose at a more moderate rate, but balances remain elevated
M2 has increased at an annual rate of about 4-3/4 percent since the end of 2012, notably slower than the pace registered last year. However, holdings of M2 assets--including their largest component, liquid deposits--remained elevated relative to what would have been expected based on historical relationships with nominal income and interest rates, likely due to investors' continued preference to hold safe and liquid assets. The monetary base--which is equal to the sum of currency and reserve balances--increased briskly over the first half of the year, driven mainly by the significant rise in reserve balances due to the Federal Reserve's asset purchases.
International Developments
International Developments
Foreign bond yields have risen and asset prices have declined, on net, especially in emerging market economies
Foreign benchmark sovereign yields have moved somewhat higher, on net, since the beginning of the year (figure 42). Rates moved lower in March and April, in part reflecting weak incoming data on activity; anticipation of the Bank of Japan's (BOJ) asset purchase program may have also contributed to declining Japanese government bond (JGB) yields early in the year. Since early May, however, as with U.S. Treasury securities, sovereign yields have risen worldwide, as investors responded to better-than-expected U.S. economic data and to Federal Reserve communications about monetary policy. Sovereign yields are up, on net, in Europe, Japan, and Canada and have increased substantially in Korea, Mexico, and other emerging market economies (EMEs).
Equity indexes in the major advanced foreign economies (AFEs) rose earlier in the year (figure 43), especially in Japan, where stock prices continued to soar as Prime Minister Abe's ambitious stimulus program began to take shape. However, since mid-May, equity prices have declined on net. Corporate bond issuance eased somewhat in June as rates climbed higher, but year-to-date issuance totals are still strong relative to recent years. Since the start of the year, sovereign and corporate credit spreads have narrowed slightly. Financial stresses in Europe have remained well below their highs last year despite banking problems in Cyprus and political tensions in several other European countries.
Figure 42. 10-Year Nominal Benchmark Yields, 2012-13
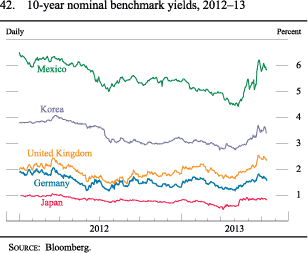
The data are daily and extend through July 12, 2013.
Source: Bloomberg.
Figure 43. Equity Indexes for Selected Foreign Economies, 2012-13
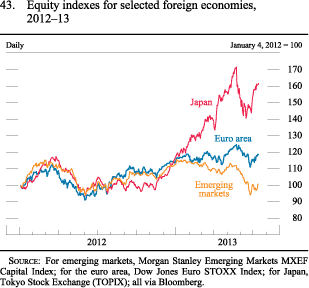
The data are daily and extend through July 12, 2013.
Source: For emerging markets, Morgan Stanley Emerging Markets MXEF Capital Index; for the euro area, Dow Jones Euro STOXX Index; for Japan, Tokyo Stock Exchange (TOPIX); all via Bloomberg.
The significantly higher interest rates in EMEs have been accompanied by sharp moves in other EME financial markets. Since mid-May, stock prices have declined and credit spreads have widened markedly. EME bond and equity funds have also experienced sizable outflows, as investors reassessed the economic outlook in these economies as well as the returns on EME assets relative to those in advanced economies.
The improved sentiment toward the U.S. economic outlook and anticipation of less-accommodative monetary policy have pushed the U.S. dollar higher against a broad set of currencies since the end of 2012 (figure 44). In particular, the dollar has appreciated sharply against the Japanese yen, on net, as the BOJ adopted a more accommodative monetary policy stance.
Figure 44. U.S. Dollar Exchange Rate against Broad Index and Selected Major Currencies, 2012-13
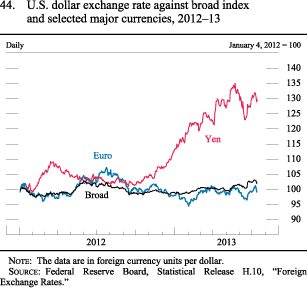
The data are in foreign currency units per dollar.
Source: Federal Reserve Board, Statistical Release H.10, "Foreign Exchange Rates."
Activity in the advanced foreign economies remained subdued despite a pickup . . .
Activity in the AFEs improved to a still-muted pace in the first half of 2013 (figure 45), supported in part by stronger exports and the easing in financial stresses in Europe. The euro-area economy shrank further in the first quarter, but the pace of contraction moderated as consumption stabilized. In the United Kingdom, real GDP resumed growing, at a 1-1/4 percent pace, in the first quarter; retail sales and the purchasing managers index (PMI) suggest that growth firmed in the second quarter. First-quarter activity accelerated in Japan, reflecting a strong rebound of exports and a pickup in consumption. Canadian growth also firmed in the first quarter, and the labor market notched solid employment gains through the second quarter.
Figure 45. Real Gross Domestic Product Growth in Selected Advanced Foreign Economies, 2010-13
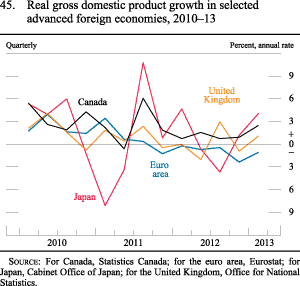
Source: For Canada, Statistics Canada; for the euro area, Eurostat; for Japan, Cabinet Office of Japan; for the United Kingdom, Office for National Statistics.
With activity weak and inflationary pressures low, several foreign central banks took additional steps to support their economies. (See the box "The Expansion of Central Bank Balance Sheets" for a broader overview of central bank actions.) The European Central Bank (ECB) and the Reserve Bank of Australia lowered their main policy rates, and the ECB stated after its July meeting that it will keep key policy rates low "for an extended period." The Bank of England extended its Funding for Lending Scheme until January 2015 and increased banks' incentives to lend to small and medium-sized businesses. In April, the BOJ announced a sharp rise in its purchases of JGBs and other assets, as well as an extension of the maturity of the JGBs that it purchases.
Authorities in some AFEs also eased fiscal policy in response to still-subdued activity. The Japanese parliament approved a fiscal stimulus package worth about 2 percent of GDP, with the bulk of the spending directed to infrastructure projects. European authorities postponed deadlines for several euro-area countries, including France and Spain, to reduce fiscal deficits below 3 percent of GDP.
The Expansion of Central Bank Balance Sheets
The severity of the recession associated with the global financial crisis led central banks in some of the advanced economies to take policy measures that drove short-term market interest rates nearly to zero. As the recession dragged on, however, several major central banks--including the Federal Reserve, the Bank of England (BOE), the Bank of Japan (BOJ), and the European Central Bank (ECB)--sought to provide further economic stimulus through the adoption of unconventional policies that aimed to reduce longer-term interest rates and ease financial conditions more generally. These policies, which included purchases of longer-term assets and repurchase operations with extended terms to maturity, left the central banks with balance sheets of unprecedented size. Total assets of the Federal Reserve rose from about 6 percent of gross domestic product (GDP) (around $870 billion) in the summer of 2007 to 22 percent of GDP ($3.5 trillion) as of June 2013. As shown in figure A, the assets of the BOE, BOJ, and ECB also increased markedly relative to the sizes of their economies. This box offers some detail on the circumstances and policies that led to the balance sheet expansions for these central banks.
Accessible Version of Figure A
Like the Federal Reserve, the BOE began its asset purchases relatively soon after the advent of the global financial crisis. Also like the Federal Reserve, the goals of the BOE's purchases were to help lower longer-term interest rates and to ease financial conditions more broadly, thereby providing further support for economic growth. During its initial program, between March 2009 and January 2010, the BOE bought £200 billion (14 percent of GDP) of longer-term assets, mostly U.K. government bonds, with commercial paper and corporate bonds making up the residual. The BOE resumed purchases in October 2011 as the economy continued to struggle amid spillovers from the euro-area financial crisis. Total securities holdings are currently near £375 billion, or almost 25 percent of GDP, and account for nearly all of the BOE's balance sheet.
Compared with the Federal Reserve or the BOE, initially the BOJ did not expand its balance sheet as much during the crisis, but more recently it has laid out plans for substantial asset purchases. By late 2010, with entrenched deflation and GDP still well below its pre-crisis peak, the BOJ announced its Asset Purchase Program of about ¥35 trillion (about 7 percent of GDP) and later expanded the size of the program to ¥101 trillion by the end of 2012. But in January of this year, the BOJ announced plans to begin a series of open-ended asset purchases in pursuit of its now-higher 2 percent inflation target. And, finally, in April the BOJ announced that it would enter a new phase of monetary easing, accelerating asset purchases to double the monetary base within two years in pursuit of its inflation target. The BOJ also substantially extended the maturity of its Japanese government bond (JGB) purchases. All maturities, including 40-year bonds, are eligible, and the average maturity of JGB purchases has risen from slightly less than 3 years to about 7 years. To date, asset purchases have increased the size of the BOJ's balance sheet to almost 40 percent of GDP. The BOJ expects its balance sheet to reach approximately 60 percent of 2012 GDP by the end of 2014.
In contrast to the other central banks, the ECB has taken a different approach to balance sheet expansion but, nonetheless, one that has offered support to economic activity. The ECB has conducted very few outright purchase operations. The main exception was the Securities Markets Programme, terminated in late 2012, under which the ECB holdings reached almost €220 billion in peripheral sovereign debt in January 2012 (about 2.5 percent of euro-area GDP). Instead, its substantial balance sheet expansion has been driven primarily by loans to banks and, in particular, longer-term refinancing operations (LTROs), which have maturities of one month or longer. In the fall of 2008, departing from its past practice of offering banks a fixed amount of loans at interest rates determined by auction, the ECB announced it would provide unlimited collateralized loans to banks at a fixed rate. The size of the ECB's balance sheet increased about €0.5 trillion (almost 6 percent of the GDP of the euro area) to about €2 trillion (around 22 percent of euro-area GDP) in 2008 and remained near that level until mid-2011. Severely deteriorating financial conditions in Europe led the ECB in December 2011 to announce LTROs with maturities of three years. Banks drew a bit more than €1 trillion under these LTROs, pushing the ECB's balance sheet to over 30 percent of GDP. The stated aim of the LTROs was to provide liquidity to the financial system rather than to ease monetary policy. However, insofar as the LTROs helped pushed down bank funding costs and sovereign yields in vulnerable European countries and alleviated financial stresses more generally, they likely provided some support to economic activity as well. By the same token, the ECB's latest program, Outright Monetary Transactions (OMT), is focused on reducing the currency risk premium embedded in European sovereign bonds, which has the benefit of easing financial conditions generally but especially in countries with high sovereign spreads. To this point, no purchases have been made under the OMT program. Even so, its availability as a backstop appears to have helped ease financial stresses in Europe, which, in turn, has likely reduced the downward pressure on the economy.
. . . while growth slowed in the emerging market economies
Aggregate real GDP growth in the EMEs picked up in the fourth quarter of 2012 despite the weakness in Europe and the United States, led by a strong performance of the Chinese economy. However, EME growth slowed considerably in the first quarter, in part as a step-down in Chinese growth weighed on activity in the rest of emerging Asia and on the commodity-dependent economies of South America. Recent indicators of exports, industrial production, and PMIs suggest that EME activity remained subdued in the second quarter. Amid concerns about economic growth and lack of inflationary pressures, the central banks of several countries in Asia and Latin America further eased monetary policy over the first half of the year. However, more recently, concerns about reversal of capital inflows and currency depreciation pressures are giving EME central banks pause about further rate cuts, and a few have begun to raise rates.
In China, macroeconomic data for the second quarter indicate that growth continued to be modest by the standards of recent years. Although retail sales rose slightly faster in April and May than in the subdued first quarter, fixed investment increased at roughly its first-quarter pace.
Activity also cooled across Latin America. In Mexico, growth had already slowed in the second half of last year, weighed down by weaker U.S. manufacturing activity. Growth slowed further in the first quarter, as exports declined and domestic demand weakened. In response, the Bank of Mexico reduced its policy rate for the first time since mid-2009. Mexican activity appears to have remained subdued in the second quarter. Brazilian real GDP growth stepped down a little in the first quarter, extending the lackluster performance of the past two years. Indicators of economic activity for the second quarter, including industrial production and exports, have been mixed. Unlike many of its EME counterparts, Brazil's central bank raised its policy rate to combat rising inflation.
Footnotes
1. As was discussed in the box "Assessing Conditions in the Labor Market" in the February 2013 Monetary Policy Report, the unemployment rate typically provides a very good summary of labor market conditions; however, other indicators also provide important perspectives on the health of the labor market, with the most accurate assessment of labor market conditions obtained by combining the signals from many such indicators. For the box, see Board of Governors of the Federal Reserve System (2013), Monetary Policy Report (Washington: Board of Governors, February), www.federalreserve.gov/monetarypolicy/mpr_20130226_part1.htm.
2. The question in the Michigan survey asks about inflation generally but does not refer to any specific price index.
3. The income data have been quite volatile in recent months, reflecting both direct and indirect effects of the changes in tax policy this year. Personal income is reported to have surged late last year and then fallen back sharply early this year, as many firms apparently shifted dividend and employee bonus payments into 2012 in anticipation of higher marginal tax rates for high-income households this year. In addition, the rise in the payroll tax rate and a surge in personal income taxes at the beginning of the year pushed down disposable personal income in the first quarter.
4. Data releases for the Survey of Terms of Business Lending are available on the Federal Reserve Board's website at www.federalreserve.gov/releases/e2/default.htm.
5. The results of the survey of primary dealers are available on the Federal Reserve Bank of New York's website at www.newyorkfed.org/markets/primarydealer_survey_questions.html .
6. Dollar roll transactions consist of a purchase or sale of agency MBS with the simultaneous agreement to sell or purchase substantially similar securities on a specified future date. The Committee directs the Desk to engage in these transactions as necessary to facilitate settlement of the Federal Reserve's agency MBS purchases.
7. The new market risk capital rule requires banking organizations with significant trading activities to adjust their capital requirements to better account for the market risks of those activities. For more information on this change, see Board of Governors of the Federal Reserve System (2012), "Federal Reserve Board Approves Final Rule to Implement Changes to Market Risk Capital Rule," press release, June 7, www.federalreserve.gov/newsevents/press/bcreg/20120607b.htm.
Monetary Policy
With unemployment still well above normal levels and inflation below its longer-run objective, the Federal Open Market Committee (FOMC) has continued its highly accommodative monetary policy this year by maintaining its forward guidance with regard to the target for the federal funds rate and continuing its program of large-scale asset purchases. With unemployment still well above normal levels and inflation below its longer-run objective, the Federal Open Market Committee (FOMC) has continued its highly accommodative monetary policy this year by maintaining its forward guidance with regard to the target for the federal funds rate and continuing its program of large-scale asset purchases.
To foster the attainment of maximum employment and price stability, the FOMC kept in place its forward guidance on the path of the federal funds rate . . .
With unemployment still elevated and declining only gradually, and inflation having moved further below the Committee's 2 percent longer-run objective, the FOMC has maintained its highly accommodative monetary policy stance this year. Because the target range for the federal funds rate remains at its effective lower bound, the Committee has been relying mainly on its forward guidance about the future path of the federal funds rate and on its program of large-scale asset purchases to make progress toward its mandated objectives.
With regard to the federal funds rate, the Committee has continued to indicate its expectation that the current exceptionally low target range of 0 to 1/4 percent will be appropriate at least as long as the unemployment rate remains above 6-1/2 percent, inflation between one and two years ahead is projected to be no more than a half percentage point above the Committee's 2 percent longer-run goal, and longer-term inflation expectations continue to be well anchored (figure 46). In determining how long to maintain its target range for the federal funds rate, the Committee has stated that it would also consider other information, including additional measures of labor market conditions, indicators of inflation pressures and inflation expectations, and readings on financial developments. The FOMC also has reiterated that a highly accommodative stance of monetary policy would remain appropriate for a considerable time after the asset purchase program ends and the economic recovery strengthens. Moreover, the Committee has indicated that when it decides to begin to remove policy accommodation, it would take a balanced approach consistent with its longer-run goals of maximum employment and inflation of 2 percent.
Figure 46. Selected Interest Rates, 2008-13
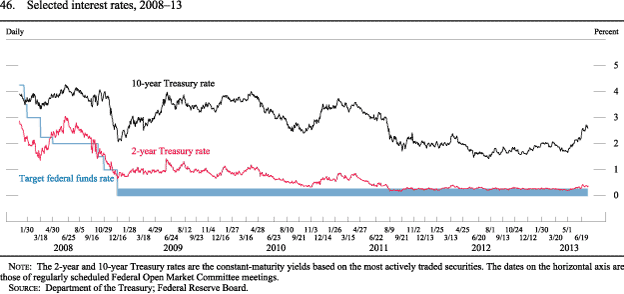
The 2-year and 10-year Treasury rates are the constant-maturity yields based on the most actively traded securities.
Source: Department of the Treasury.
. . . and maintained its policy of large-scale asset purchases . . .
To sustain downward pressure on longer-term interest rates, support mortgage markets, and help make broader financial conditions more accommodative, the FOMC has continued its large-scale asset purchases; the Committee also has maintained its practices of reinvesting principal payments it receives on agency debt and agency-guaranteed mortgage-backed securities (MBS) in new agency MBS and of rolling over maturing Treasury securities at auction. Over the first half of this year, purchases of longer-term securities totaled $510 billion, with the Committee purchasing additional agency MBS at a pace of $40 billion per month and longer-term Treasury securities at a pace of $45 billion per month. The Committee reconfirmed at each meeting during the first half of 2013 that it would continue purchasing Treasury and agency MBS until the outlook for the labor market has improved substantially in a context of price stability.
In determining the size, pace, and composition of its asset purchases, the Committee has taken account of the likely efficacy and costs of such purchases. As noted in the minutes of the March FOMC meeting, most participants saw asset purchases as having a meaningful effect in easing financial conditions--for example, keeping longer-term interest rates, including mortgage rates, lower than they would be otherwise--and so supporting economic growth.8 FOMC participants generally judged that these benefits outweighed the likely costs and risks of additional purchases. However, the Committee has continued to monitor those costs and risks, including possible effects on financial stability, security market functioning, the smooth withdrawal of monetary accommodation when it eventually becomes appropriate, and the Federal Reserve's net income.9
. . . while providing additional information about potential adjustments to its asset purchases
During the first half of 2013, the FOMC took various steps to provide greater clarity regarding its thinking about possible adjustments in the pace of asset purchases and the eventual cessation of those purchases. In its statement after the March meeting, the Committee added that the size, pace, and composition of its asset purchases would reflect the extent of progress toward its economic objectives, in addition to the likely efficacy and costs of such purchases.10 And in May, to highlight its willingness to adjust the flow of purchases in light of incoming information, the Committee noted that it was prepared to increase or reduce the pace of its purchases to maintain appropriate policy accommodation as the outlook for the labor market or inflation changed.11
At the June FOMC meeting, Committee participants generally thought it would be helpful to provide greater clarity about the Committee's approach to decisions about its asset purchase program and thereby reduce investors' uncertainty about how it might react to future economic developments. In choosing to provide this clarification, the Committee made no changes to its approach to monetary policy. Against this backdrop, Chairman Bernanke, at his postmeeting press conference, described a possible path for asset purchases that the Committee would anticipate implementing if economic conditions evolved in a manner broadly consistent with the outcomes the Committee saw as most likely.12 The Chairman noted that such economic outcomes involved continued gains in labor markets, supported by moderate growth that picks up over the next several quarters, and inflation moving back toward its 2 percent objective over time. If the economy were to evolve broadly in line with the Committee's expectations, the FOMC would moderate the pace of purchases later this year and continue to reduce the pace of purchases in measured steps until purchases ended around the middle of next year, at which time the unemployment rate would likely be in the vicinity of 7 percent, with solid economic growth supporting further job gains and inflation moving back toward the FOMC's 2 percent target.
In emphasizing that the Committee's policy was in no way predetermined, the Chairman noted that if economic conditions improved faster than expected, the pace of asset purchases could be reduced somewhat more quickly. Conversely, if the outlook for the economy or the labor market became less favorable, inflation did not move over time toward the Committee's 2 percent longer-term objective, or financial conditions were judged to be inconsistent with further progress in the labor markets, reductions in the pace of purchases could be delayed or the pace increased for a time. The Chairman also drew a strong distinction between the asset purchase program and the forward guidance regarding the target for the federal funds rate, noting that the Committee anticipates that there will be a considerable period between the end of asset purchases and the time when it becomes appropriate to increase the target for the federal funds rate.
The Committee's large-scale asset purchases led to a significant increase in the size of the Federal Reserve's balance sheet
As a result of the Committee's large-scale asset purchase program, Federal Reserve assets have increased significantly since the end of last year (figure 47). The par value of the System Open Market Account's (SOMA) holdings of U.S. Treasury securities increased about $300 billion to $2 trillion, and the par value of its holdings of agency debt and MBS increased about $270 billion, on net, to $1.3 trillion.13 These asset purchases accounted for nearly all of the increase in total assets of the Federal Reserve and were accompanied by a significant rise in reserve balances over the period. As of July 10, the SOMA's holdings of Treasury and agency securities constituted 56 percent and 36 percent, respectively, of the $3.5 trillion in total Federal Reserve assets. By contrast, balances of facilities established during the financial crisis declined further from already low levels.14
Figure 47. Federal Reserve Assets and Liabilities, 2008-13
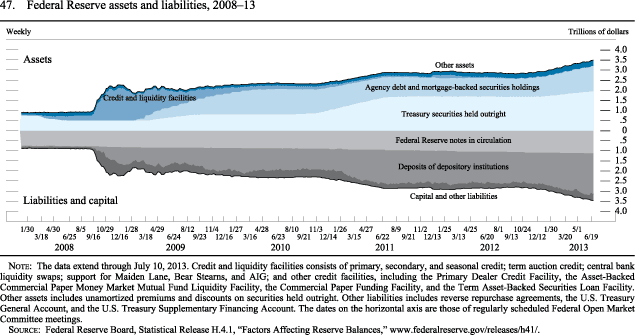
The data extend through July 10, 2013. Data values are rounded and may not sum to totals. Other liabilities includes reverse repurchase agreements, the U.S. Treasury General Account, and the U.S. Treasury Supplementary Financing Account. The dates on the horizontal axis are those of regularly scheduled Federal Open Market Committee meetings.
Source: Federal Reserve Board, Statistical Release H.4.1, "Factors Affecting Reserve Balances," www.federalreserve.gov/releases/h41/.
Interest income on the SOMA portfolio continued to support a substantial sum of remittances to the Treasury Department. In the first quarter, the Federal Reserve provided more than $15 billion of such distributions to the Treasury.15 The Federal Reserve has also released detailed transactions data on open market operations and discount window operations with a two-year lag in compliance with the Dodd-Frank Wall Street Reform and Consumer Protection Act of 2010.
The Committee also reviewed the principles for policy normalization
During its May and June meetings, the FOMC reviewed the Federal Reserve's principles for the eventual normalization of the stance of monetary policy, which initially were published in the minutes of the Committee's June 2011 meeting.16 The Committee's discussion included various aspects of those principles--the size and composition of the SOMA portfolio in the longer run, the use of a range of reserve-draining tools, the approach to sales of securities, the eventual framework for policy implementation, and the relationship between the principles and the economic thresholds in the Committee's forward guidance on the federal funds rate. Meeting participants, in general, continued to view the broad principles set out in 2011 as still applicable. Nonetheless, they agreed that many of the details of the eventual normalization process would likely differ from those specified two years ago, that the appropriate details would depend in part on economic and financial developments between now and the time when it becomes appropriate to begin normalizing monetary policy, and that the Committee would need to provide additional information about its intentions as that time approaches. Participants continued to think that the Federal Reserve should, in the long run, hold predominantly Treasury securities. Most, however, now anticipated that the Committee would not sell agency MBS as part of the normalization process, although some indicated that limited sales might be warranted in the longer run to reduce or eliminate residual holdings.
The Federal Reserve continued to test tools that could potentially be used to manage reserves
As part of the Federal Reserve's ongoing program to ensure the readiness of tools to manage reserves, the Federal Reserve conducted a series of small-scale transactions with eligible counterparties. During the first half of 2013, the Federal Reserve conducted four repurchase agreement (repo) operations and three reverse repurchase agreement (reverse repo) operations. Operation sizes ranged between $0.2 and $2.8 billion using all eligible collateral types. While the repo transactions were conducted only with primary dealers, two of the reverse repo operations were open to the expanded set of eligible counterparties, which include not only primary dealers, but also banks, government-sponsored enterprises, and money market funds.17 In addition, the Federal Reserve Board conducted three operations for 28-day term deposits under the Term Deposit Facility (TDF). These operations included two competitive single-price TDF auctions totaling $3 billion in deposits and an offering with a fixed-rate, full-allotment format, which totaled $10 billion in deposits.
Back to section top
Footnotes
8. See Board of Governors of the Federal Reserve System (2013), "Minutes of the Federal Open Market Committee, March 19-20, 2013," press release, April 10, www.federalreserve.gov/newsevents/press/monetary/20130410a.htm.
9. For further discussion of these issues, see the box "Efficacy and Costs of Large-Scale Asset Purchases" in Board of Governors of the Federal Reserve System (2013), Monetary Policy Report (Washington: Board of Governors, February), www.federalreserve.gov/monetarypolicy/mpr_20130226_part2.htm.
10. See Board of Governors of the Federal Reserve System (2013), "Federal Reserve Issues FOMC Statement," press release, March 20, www.federalreserve.gov/newsevents/press/monetary/20130320a.htm.
11. See Board of Governors of the Federal Reserve System (2013), "Federal Reserve Issues FOMC Statement," press release, May 1, www.federalreserve.gov/newsevents/press/monetary/20130501a.htm.
12. See Ben S. Bernanke (2013), "Transcript of Chairman Bernanke's Press Conference," June 19, www.federalreserve.gov/mediacenter/files/FOMCpresconf20130619.pdf.
13. The difference between changes in the par value of SOMA holdings and the amount of purchases of securities since the end of 2012 reflects, in part, lags in settlements.
14. The outstanding amount of dollars provided through the temporary U.S. dollar liquidity swap arrangements with foreign central banks decreased $7 billion to about $1 billion because of the improvement in offshore U.S. dollar funding markets. During the financial crisis, the Federal Reserve created several special lending facilities to support financial institutions and markets and strengthen economic activity. These facilities were closed by 2010; however, some loans made under the Term Asset-Backed Securities Loan Facility, which is closed to new lending, remain outstanding and will mature over the next two years. Other programs supported certain specific institutions in order to avert disorderly failures that could have resulted in severe dislocations and strains for the financial system as a whole and harmed the U.S. economy. While the loans made by the Federal Reserve under these programs have been repaid, the Federal Reserve will continue to receive cash flows generated from assets remaining in the portfolios established in connection with such support, principally the portfolio of Maiden Lane LLC.
15. The Quarterly Report on Federal Reserve Balance Sheet Developments for the first quarter is available on the Federal Reserve Board's website at www.federalreserve.gov/monetarypolicy/quarterly-balance-sheet-developments-report.htm.
16. See Board of Governors of the Federal Reserve System (2011), "Minutes of the Federal Open Market Committee, June 21-22, 2011," press release, July 12, www.federalreserve.gov/newsevents/press/monetary/20110712a.htm.
17. To prepare for the potential need to conduct large-scale reverse repo transactions, the Federal Reserve Bank of New York is developing arrangements with an expanded set of counterparties with which it can conduct these transactions. These counterparties are in addition to the existing set of primary dealer counterparties with whom the Federal Reserve can already conduct reverse repos. The list of the expanded set of counterparties is available on the Federal Reserve Bank of New York's website at www.newyorkfed.org/markets/expanded_counterparties.html .
Summary of Economic Projections
In conjunction with the June 18-19, 2013, Federal Open Market Committee (FOMC) meeting, meeting participants--the 7 members of the Board of Governors and the 12 presidents of the Federal Reserve Banks, all of whom participate in the deliberations of the FOMC--submitted their assessments of real output growth, the unemployment rate, inflation, and the target federal funds rate for each year from 2013 through 2015 and over the longer run.18 Each participant's assessment was based on information available at the time of the meeting plus his or her judgment of appropriate monetary policy and assumptions about the factors likely to affect economic outcomes. The longer-run projections represent each participant's judgment of the value to which each variable would be expected to converge, over time, under appropriate monetary policy and in the absence of further shocks to the economy. "Appropriate monetary policy" is defined as the future path of policy that each participant deems most likely to foster outcomes for economic activity and inflation that best satisfy his or her individual interpretation of the Federal Reserve's objectives of maximum employment and stable prices.
Overall, FOMC participants projected that, under appropriate monetary policy, the pace of economic recovery would gradually pick up over the 2013-15 period, and inflation would move up from recent very low readings but remain subdued (table 1 and figure 1). Almost all of the participants projected that inflation, as measured by the annual change in the price index for personal consumption expenditures (PCE), would be running at or a little below the Committee's 2 percent objective in 2015.
Table 1. Economic projections of Federal Reserve Board members and Federal Reserve Bank presidents, June 2013 Percent
1. The central tendency excludes the three highest and three lowest projections for each variable in each year. Return to table
2. The range for a variable in a given year includes all participants' projections, from lowest to highest, for that variable in that year. Return to table
3. Longer-run projections for core PCE inflation are not collected. Return to table
As shown in figure 2, most participants judged that highly accommodative monetary policy was likely to be warranted over the next few years to support continued progress toward maximum employment and a gradual return toward 2 percent inflation. Moreover, all participants but one judged that it would be appropriate to continue purchasing both agency mortgage-backed securities (MBS) and longer-term Treasury securities at least until later this year.
A majority of participants saw the uncertainty associated with their outlook for economic growth and the unemployment rate as similar to that of the past 20 years. An equal number of participants also indicated that the risks to the outlook for real gross domestic product (GDP) growth and the unemployment rate were broadly balanced. Some participants, however, continued to see downside risks to growth and upside risks to unemployment. A majority of participants indicated that the uncertainty surrounding their projections for PCE inflation was similar to historical norms, and nearly all considered the risks to inflation to be either broadly balanced or weighted to the downside.
The Outlook for Economic Activity
The central tendency of participants' projections for real GDP growth was 2.3 to 2.6 percent for 2013, 3.0 to 3.5 percent for 2014, and 2.9 to 3.6 percent for 2015. Most participants noted that their projections were little changed since March, with the downward revisions to growth in 2013 reflecting the somewhat slower-than-anticipated growth in the first half. The central tendency for the longer-run rate of growth of real GDP was 2.3 to 2.5 percent, unchanged from March.
Participants anticipated a gradual decline in the unemployment rate over the forecast period; a large majority projected that the unemployment rate would not reach their estimates of its longer-run level before 2016. The central tendencies of participants' forecasts for the unemployment rate were 7.2 to 7.3 percent at the end of 2013, 6.5 to 6.8 percent at the end of 2014, and 5.8 to 6.2 percent at the end of 2015. These projections were slightly lower than in March, with participants reacting to recent data indicating that the unemployment rate had declined by a little more than they had previously expected. The central tendency of participants' estimates of the longer-run normal rate of unemployment that would prevail under appropriate monetary policy and in the absence of further shocks to the economy was 5.2 to 6.0 percent, the same as in March. Most participants projected that the unemployment rate would converge to their estimates of its longer-run normal rate in five or six years, while some judged that less time would be needed.
As shown in figures 3.A and 3.B, the distributions of participants' views regarding the likely outcomes for real GDP growth and the unemployment rate were relatively narrow for 2013. Their projections for economic activity were more diverse for 2014 and 2015, reflecting their individual assessments of appropriate monetary policy and its economic effects, the likely rate of improvement in the housing sector and households' balance sheets, the domestic implications of foreign economic developments, the prospective path for U.S. fiscal policy, the extent of structural dislocations to the labor market, and a number of other factors. The dispersion of participants' projections for 2015 and for the longer run was little changed relative to March; there was some reduction in the upper ends of the distributions in 2013 and 2014 for both real GDP growth and the unemployment rate.
Accessible Version of Figure 3A
Accessible Version of Figure 3B
The Outlook for Inflation
Figures 3.C and 3.D provide information on the diversity of participants' views about the outlook for inflation. The range of participants' projections for overall and core inflation in 2013 shifted down, while those ranges narrowed in 2014-15. The distributions for core and overall inflation in 2015 remained concentrated near the Committee's longer-run objective, and all participants continued to project that overall inflation would converge to the FOMC's 2 percent goal over the longer run.
Accessible Version of Figure 3C
Accessible Version of Figure 3D
Appropriate Monetary Policy
All of the participants who judged that raising the federal funds rate target would become appropriate in 2015 also projected that the unemployment rate would decline below 6-1/2 percent during that year and that inflation would remain near or below 2 percent. In addition, most of those participants also projected that a sizable gap between the unemployment rate and the longer-run normal level of the unemployment rate would persist until 2015 or later. Three of the four participants who judged that policy firming should begin in 2013 or 2014 indicated that, in their judgment, the Committee would need to act relatively soon in order to keep inflation near the FOMC's longer-run objective of 2 percent and to keep longer-run inflation expectations well anchored.
Figure 3.E provides the distribution of participants' judgments regarding the appropriate level of the target federal funds rate at the end of each calendar year from 2013 to 2015 and over the longer run. As previously noted, most participants judged that economic conditions would warrant maintaining the current low level of the federal funds rate at least until 2015. Among the four participants who saw the federal funds rate leaving the effective lower bound earlier, their projections for the federal funds rate at the end of 2014 ranged from 1 to 1-1/2 percent; however, the median for all participants remained at the effective lower bound. Views on the appropriate level of the federal funds rate at the end of 2015 varied, with the range of participants' projections a bit narrower than in the March Summary of Economic Projections and the median value unchanged at 1 percent.
All participants saw the appropriate target for the federal funds rate at the end of 2015 as still well below their assessments of its expected longer-run value. Estimates of the longer-run target federal funds rate ranged from 3-1/4 to 4-1/2 percent, reflecting the Committee's inflation objective of 2 percent and participants' individual judgments about the appropriate longer-run level of the real federal funds rate in the absence of further shocks to the economy.
Participants also described their views regarding the appropriate path of the Federal Reserve's balance sheet. Given their respective economic outlooks, all participants but one judged that it would be appropriate to continue purchasing both agency MBS and longer-term Treasury securities. About half of these participants indicated that it likely would be appropriate to end asset purchases late this year. Many other participants anticipated that it likely would be appropriate to continue purchases into 2014. Several participants emphasized that the asset purchase program was effective in supporting the economic expansion, that the benefits continued to exceed the costs, or that continuing purchases would be necessary to achieve a substantial improvement in the outlook for the labor market. A few participants, however, indicated that the Committee could best foster its dual objectives and limit the potential costs of the program by slowing, or stopping, its purchases at the June meeting.
Key factors informing participants' views of the appropriate path for monetary policy included their judgments regarding the values of the unemployment rate and other labor market indicators that would be consistent with maximum employment; the extent to which the economy fell short of maximum employment and the extent to which inflation was running below the Committee's longer-term objective of 2 percent; and the implications of alternative policy paths for the likely extent of progress, over the medium-term, in returning employment and inflation to mandate-consistent levels. A couple of participants noted that persistent headwinds and somewhat slower productivity growth since the end of the recession made their assessments of the longer-run normal level of the federal funds rate, and thus of the appropriate path for the federal funds rate, lower than would otherwise be the case.
Uncertainty and Risks
Figure 4. Uncertainty and risks in economic projections
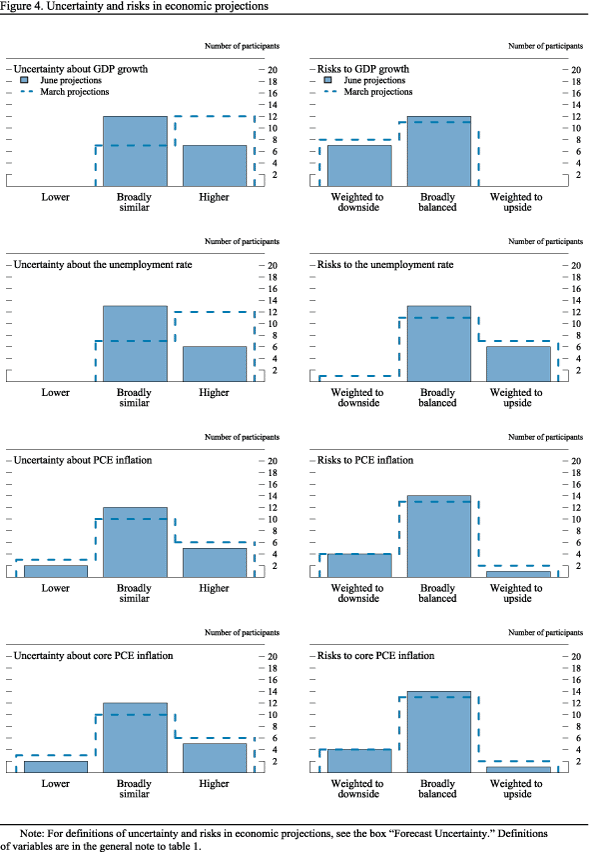
For definitions of uncertainty and risks in economic projections, see the box "Forecast Uncertainty." Definitions of variables are in the general note to table 1.
Table 2. Average historical projection error ranges Percentage points
Note: Error ranges shown are measured as plus or minus the root mean squared error of projections for 1993 through 2012 that were released in the summer by various private and government forecasters. As described in the box "Forecast Uncertainty," under certain assumptions, there is about a 70 percent probability that actual outcomes for real GDP, unemployment, and consumer prices will be in ranges implied by the average size of projection errors made in the past. Further information is in David Reifschneider and Peter Tulip (2007), "Gauging the Uncertainty of the Economic Outlook from Historical Forecasting Errors," Finance and Economics Discussion Series 2007-60 (Washington: Board of Governors of the Federal Reserve System, November).
1. Definitions of variables are in the general note to table 1. Return to table
2. Measure is the overall consumer price index, the price measure that has been most widely used in government and private economic forecasts. Projection is percent change, fourth quarter of the previous year to the fourth quarter of the year indicated. Return to table
Participants reported little change in their assessments of the level of uncertainty and the balance of risks around their forecasts for overall PCE inflation and core inflation. Fourteen participants judged the levels of uncertainty associated with their forecasts for those inflation measures to be broadly similar to, or lower than, historical norms; the same number saw the risks to those projections as broadly balanced. A few participants highlighted the likely role played by the Committee's adoption of a 2 percent inflation goal or its commitment to maintaining accommodative monetary policy as contributing to the recent stability of longer-term inflation expectations and, hence, the relatively low level of uncertainty. Four participants saw the risks to their inflation forecasts as tilted to the downside, reflecting, for example, risks of disinflation that could arise from adverse shocks to the economy that policy would have limited scope to offset in the current environment. Conversely, one participant saw the risks to inflation as weighted to the upside, citing the present highly accommodative stance of monetary policy and concerns about the Committee's ability to shift to a less accommodative policy stance when it becomes appropriate to do so.
Forecast Uncertainty
The economic projections provided by the members of the Board of Governors and the presidents of the Federal Reserve Banks inform discussions of monetary policy among policymakers and can aid public understanding of the basis for policy actions. Considerable uncertainty attends these projections, however. The economic and statistical models and relationships used to help produce economic forecasts are necessarily imperfect descriptions of the real world, and the future path of the economy can be affected by myriad unforeseen developments and events. Thus, in setting the stance of monetary policy, participants consider not only what appears to be the most likely economic outcome as embodied in their projections, but also the range of alternative possibilities, the likelihood of their occurring, and the potential costs to the economy should they occur.
Table 2 summarizes the average historical accuracy of a range of forecasts, including those reported in past Monetary Policy Reports and those prepared by the Federal Reserve Board's staff in advance of meetings of the Federal Open Market Committee. The projection error ranges shown in the table illustrate the considerable uncertainty associated with economic forecasts. For example, suppose a participant projects that real gross domestic product (GDP) and total consumer prices will rise steadily at annual rates of, respectively, 3 percent and 2 percent. If the uncertainty attending those projections is similar to that experienced in the past and the risks around the projections are broadly balanced, the numbers reported in table 2 would imply a probability of about 70 percent that actual GDP would expand within a range of 2.0 to 4.0 percent in the current year, 1.4 to 4.6 percent in the second year, and 1.2 to 4.8 percent in the third year. The corresponding 70 percent confidence intervals for overall inflation would be 1.2 to 2.8 percent in the current year and 1.0 to 3.0 percent in the second and third years.
Because current conditions may differ from those that prevailed, on average, over history, participants provide judgments as to whether the uncertainty attached to their projections of each variable is greater than, smaller than, or broadly similar to typical levels of forecast uncertainty in the past, as shown in table 2. Participants also provide judgments as to whether the risks to their projections are weighted to the upside, are weighted to the downside, or are broadly balanced. That is, participants judge whether each variable is more likely to be above or below their projections of the most likely outcome. These judgments about the uncertainty and the risks attending each participant's projections are distinct from the diversity of participants' views about the most likely outcomes. Forecast uncertainty is concerned with the risks associated with a particular projection rather than with divergences across a number of different projections.
As with real activity and inflation, the outlook for the future path of the federal funds rate is subject to considerable uncertainty. This uncertainty arises primarily because each participant's assessment of the appropriate stance of monetary policy depends importantly on the evolution of real activity and inflation over time. If economic conditions evolve in an unexpected manner, then assessments of the appropriate setting of the federal funds rate would change from that point forward.
Footnotes
18. Although President Pianalto was unable to attend the June 18-19, 2013, FOMC meeting, she submitted economic projections.
19. Table 2 provides estimates of the forecast uncertainty for the change in real GDP, the unemployment rate, and total consumer price inflation over the period from 1993 through 2012. At the end of this summary, the box "Forecast Uncertainty" discusses the sources and interpretation of uncertainty in the economic forecasts and explains the approach used to assess the uncertainty and risks attending the participants' projections.