July 2012 Monetary Policy Report: Full Text
Overview: Monetary Policy and the Economic Outlook
The pace of economic recovery appears to have slowed during the first half of this year, with real gross domestic product (GDP) likely having risen at only a modest pace. In the labor market, the rate of job gains has diminished recently, and, following a period of improvement, the unemployment rate has been little changed at an elevated level since January. Meanwhile, consumer price inflation over the first five months of 2012 was lower, on net, than in 2011, and longer-term inflation expectations have remained stable. A number of factors will likely restrain economic growth in the period ahead, including weak economic growth abroad and a fiscal environment that looks set to become less accommodative. Uncertainty about these factors may also restrain household and business spending. In addition, credit conditions are likely to improve only gradually, as are still-elevated inventories of vacant and foreclosed homes. Moreover, the possibility of a further material deterioration of conditions in Europe, or of a particularly severe change in U.S. fiscal conditions, poses significant downside risks to the outlook.
Against this backdrop, the Federal Open Market Committee (FOMC) took steps to provide additional monetary policy accommodation during the first half of 2012. In particular, the Committee changed its forward guidance regarding the period over which it anticipates the federal funds rate to remain at exceptionally low levels and announced a continuation of its maturity extension program (MEP) through the end of the year. These policies put downward pressure on longer-term interest rates and made broad financial conditions more accommodative than they would otherwise be, thereby supporting the economic recovery.
The European fiscal and banking crisis has remained a major source of strain on global financial markets. Early in the year, financial stresses within the euro area moderated somewhat in light of a number of policy actions: The European Central Bank (ECB) provided ample liquidity to the region's banks, euro-area leaders agreed to increase the lending capacity of their rescue facilities, and a new assistance package for Greece was approved following a restructuring of Greek sovereign debt. However, tensions within the euro area increased again in the spring as political uncertainties rekindled fears of a disorderly Greek exit from the euro area and mounting losses at Spanish banks renewed questions about the sustainability of Spain's sovereign debt and the resiliency of the euro-area banking system. As yields on the government debt of Spain and other vulnerable European countries rose toward new highs, euro-area leaders responded with additional policy measures in late June, including increasing the flexibility of the region's financial backstops and making progress toward greater cooperation in the supervision and, as necessary, recapitalization of Europe's banks. Many critical details, however, remain to be worked out against a backdrop of continued economic weakness and political strain.
Financial markets were somewhat volatile over the first half of 2012 mostly due to fluctuating views regarding the crisis in the euro area and the likely pace of economic growth at home and abroad. As investors' concerns about the situation in Europe eased early in the year and with data releases generally coming in to the upside of market expectations, broad equity price indexes rose and risk spreads in several markets narrowed. Subsequently, however, market participants pulled back from riskier assets amid renewed concerns about the euro area and evidence of slowing global economic growth. Reflecting these developments but also owing to the lengthening of the forward rate guidance, continuation of the MEP, and increased expectations by market participants of additional balance sheet actions by the Federal Reserve, yields on longer-term Treasury securities and corporate debt as well as rates on residential mortgages declined, on net, and reached historically low levels at times during the first half of the year. On balance since the beginning of the year, broad equity prices rose as corporate earnings remained fairly resilient through the first quarter.
After rising at an annual rate of 2-1/2 percent in the second half of 2011, real GDP increased at a 2 percent pace in the first quarter of 2012, and available indicators point to a still smaller gain in the second quarter. Private spending continues to be weighed down by a range of factors, including uncertainty about developments in Europe and the path for U.S. fiscal policy, concerns about the strength and sustainability of the recovery, the still-anemic state of the housing market, and the difficulties that many would-be borrowers continue to have in obtaining credit. Such considerations have made some businesses more cautious about increasing investment or materially expanding their payrolls and have led households to remain quite pessimistic about their income and employment prospects. Smoothing through the effects of unseasonably warm weather this past winter, activity in the housing sector appears to have been a little stronger so far this year. However, the level of housing activity remains low and continues to be held down by tight mortgage credit. Meanwhile, the drag on real GDP growth from government purchases is likely to persist, as budgets for state and local governments remain strained and federal fiscal policy is likely to become more restrictive in 2013.
In the labor market, gains in private payroll employment averaged 225,000 jobs per month in the first quarter, up from 165,000 jobs per month in the second half of last year, but fell back in the second quarter to just 90,000 jobs per month. Although the slowing in the pace of net job creation may have been exaggerated by issues related to swings in the weather and to seasonal adjustment difficulties associated with the timing of the sharpest job losses during the recession, those factors do not appear to fully account for the slowdown. The unemployment rate declined from about 9 percent last summer to a still-elevated 8-1/4 percent in January, and it has remained close to that level since then. Likewise, long-term joblessness has shown little net improvement this year, with the share of those unemployed persons who have been jobless for six months or longer remaining around 40 percent. Further meaningful reductions in unemployment are likely to require some pickup in the pace of economic activity.
Consumer price inflation moved down, on net, during the first half of the year. The price index for overall personal consumption expenditures (PCE) rose rapidly in the first three months of the year, reflecting large increases in oil prices, but inflation turned down in the spring when oil prices more than reversed their earlier run-ups. In all, the PCE price index increased at an annual rate of about 1-1/2 percent over the first five months of the year, compared with a rise of 2-1/2 percent during 2011. Excluding food and energy, consumer prices rose at about a 2 percent rate over the first five months of the year, close to the pace recorded over 2011. In addition to the net decline in crude oil prices over the first half of the year, factors contributing to low consumer price inflation this year include the deceleration of non-oil import prices in the latter part of 2011, subdued labor costs associated with the weak labor market, and stable inflation expectations.
In the household sector, credit conditions have generally remained tight for all but highly rated borrowers; among other factors, this tightness reflects the uncertain economic outlook and the high unemployment rate. Total mortgage debt decreased further as the pace of mortgage applications to purchase a new home was sluggish. Refinancing activity increased over the course of the second quarter but remained below levels reached in previous refinancing booms despite historically low mortgage interest rates. The increase in refinancing was partially attributable to recent enhancements made to the Home Affordable Refinance Program that appeared to boost refinancing activity somewhat for borrowers with underwater mortgages--that is, for those who owed more on their mortgages than their homes were worth. Consumer credit expanded moderately mainly because of growth in federal student loans.
Firms in the nonfinancial corporate sector continued to raise funds at a generally moderate pace in the first half of the year. Those with access to capital markets took advantage of low interest rates to refinance existing debt. As a result, corporate debt issuance was solid over the first part of the year, although issuance of speculative-grade corporate bonds weakened notably in June as investors pulled back from riskier assets. Commercial and industrial loans on the books of banks expanded briskly, but borrowing conditions for small businesses have improved more slowly than have those for larger firms. Financing conditions for commercial real estate stayed relatively restrictive, and fundamentals in that sector showed few signs of improvement.
Market sentiment toward major global banks fluctuated in the first half of 2012. In March, the release of the results from the Comprehensive Capital Analysis and Review, which investors interpreted as indicating continued improvements in the health of domestic banks, provided a significant boost to the equity prices of U.S. financial institutions. Those gains partially reversed when market sentiment worsened in May, driven in large part by concerns about Europe and potential spillovers to the United States and its financial institutions. On balance, however, equity prices of banks rose significantly from relatively low levels at the start of the year. An index of credit default swap spreads for the large bank holding companies declined about 60 basis points, but those spreads remained at a high level. Despite the swings in market sentiment about global banking organizations, conditions in unsecured short-term dollar funding markets were fairly stable in the first half of 2012. European financial institutions have reduced their demand for dollar funding over recent quarters, and general funding pressures apparently were alleviated by the ECB's longer-term refinancing operations.
With the Committee anticipating only slow progress in bringing unemployment down toward levels that it judges to be consistent with its dual mandate and strains in global financial markets continuing to pose significant downside risks to the economic outlook, the FOMC took additional steps to augment the already highly accommodative stance for monetary policy during the first half of 2012. In January, the Committee modified its forward rate guidance, noting that economic conditions were likely to warrant exceptionally low levels for the federal funds rate at least through late 2014. And in June, the FOMC decided to continue the MEP until the end of the year rather than completing the program at the end of June as previously scheduled.
The June Summary of Economic Projections is presented in Part 4 of this report. At the time of the Committee's June meeting, FOMC participants (the 7 members of the Board of Governors and the presidents of the 12 Federal Reserve Banks) saw the economy expanding at a moderate pace over coming quarters and then picking up gradually under the assumption of appropriate monetary policy. Most participants marked down their projections for economic growth in 2012 and 2013 relative to what they anticipated in January and April largely as a result of the adverse developments in Europe and the associated effects on financial markets. Moreover, headwinds from the fiscal and financial situation in Europe, from the still-depressed housing market, and from tight credit for some borrowers were cited as likely to hold back the pace of economic expansion over the forecast period.
FOMC participants also projected slower progress in reducing unemployment than they had anticipated in January and April. Committee participants' projections for the unemployment rate had a central tendency of 8.0 to 8.2 percent in the fourth quarter of this year and then declined to 7.0 to 7.7 percent at the end of 2014; those levels are still generally well above participants' estimates of the longer-run normal rate of unemployment. Meanwhile, participants' projections for inflation had a central tendency of 1.2 to 1.7 percent for 2012 and 1.5 to 2.0 percent for both 2013 and 2014; these projections are lower, particularly in 2012, than participants reported in January and April, in part reflecting the effects of the recent drop in crude oil prices.
With the unemployment rate expected to remain elevated over the projection period and inflation generally expected to be at or under the Committee's 2 percent objective, most participants expected that, under their individual assessments of appropriate monetary policy, the federal funds rate would remain extraordinarily low for some time. In particular, 11 of the 19 participants placed the target federal funds rate at 0.75 percent or lower at the end of 2014; only 4 of them saw the appropriate rate at 2 percent or higher. All participants reported levels for the appropriate target federal funds rate at the end of 2014 that were well below their estimates of the level expected to prevail in the longer run. In addition to projecting only slow progress in bringing down unemployment, most participants saw the risks to the outlook as weighted mainly toward slower growth and higher unemployment. In particular, participants noted that strains in global financial markets, the prospect of reduced fiscal accommodation in the United States, and a general slowdown in global economic growth posed significant risks to the recovery and to a further improvement in labor market conditions.
Domestic Developments
Economic activity appears to have expanded at a somewhat slower pace over the first half of 2012 than in the second half of 2011. After rising at an annual rate of 2-1/2 percent in the second half of 2011, real gross domestic product (GDP) increased at a 2 percent pace in the first quarter of 2012, and available indicators point to a still smaller gain in the second quarter (figure 1). An important factor influencing economic and financial developments this year is the unfolding fiscal and banking crisis in Europe. Indeed, the economic outlook for the second half of 2012 depends crucially on the extent to which current and potential disruptions in Europe directly reduce U.S. net exports and indirectly curtail private domestic spending through adverse spillover effects on U.S. financial markets and institutions and on household and business confidence. At the same time, the economy continues to face other headwinds, including restricted access to some types of household and small business credit, a still sizable inventory of vacant homes, and less-accommodative fiscal policy.
The labor market remains weak. Private payroll employment stepped up early in the year but then slowed in the second quarter (though those moves may have been exaggerated by issues related to swings in the weather and to seasonal adjustment), and the unemployment rate hovered around 8-1/4 percent after a significant decrease over the latter months of 2011 and in January. Meanwhile, consumer price inflation, in part buffeted by sharp swings in the price of gasoline, stepped up early in the year but subsequently turned down, and longer-term inflation expectations remained stable (figure 2).
Figure 1. Change in Real Gross Domestic Product, 2006-12
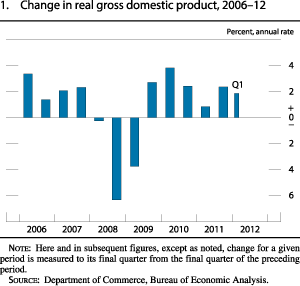
Here and in subsequent figures, except as noted, change for a given period is measured to its final quarter from the final quarter of the preceding period.
Source: Department of Commerce, Bureau of Economic Analysis.
Figure 2. Change in the Chain-Type Price Index for Personal Consumption Expenditures, 2006-12
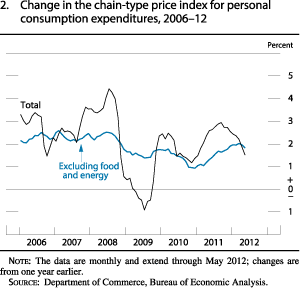
The data are monthly and extend through May 2012; changes are from one year earlier.
Source: Department of Commerce, Bureau of Economic Analysis.
Financial markets were somewhat volatile over the first half of 2012 mostly due to fluctuating views regarding the crisis in the euro area and the likely pace of economic growth at home and abroad. Yields on longer-term Treasury securities have declined significantly, reflecting greater monetary policy accommodation, the weaker outlook, and safe-haven flows. Broad indexes of U.S. equity prices rose, on net, risk spreads on corporate bonds were generally unchanged or slightly lower, and unsecured short-term dollar funding markets were fairly stable. Debt issuance by U.S. corporations was solid, and bank lending to larger firms was brisk. In the household sector, consumer credit expanded and mortgage refinancing activity increased modestly, reflecting the decline in mortgage rates to historically low levels as well as recent changes to the Home Affordable Refinance Program (HARP).
Domestic Developments
The Household Sector
Consumer Spending and Household Finance
After rising at an annual rate of about 2 percent in the second half of 2011, real personal consumption expenditures (PCE) increased 2-1/2 percent in the first quarter, but available information suggests that real PCE decelerated some in the second quarter (figure 3). The first-quarter increase in spending occurred across a broad array of goods and services with the notable exception of outlays for energy services, which were held down by reduced demand for heating because of the unseasonably warm winter. Spending on energy services appears to have rebounded in the second quarter as the temperate winter gave way to a relatively more typical spring. In contrast, the pace of motor vehicle sales edged down in the second quarter, and reports on retail sales suggest that consumer outlays on a wide range of items rose less rapidly than they did in the first quarter. The moderate rise in consumer spending over the first half of the year occurred against the backdrop of the considerable economic challenges still facing many households, including high unemployment, sluggish gains in employment, tepid growth in income, still-stressed balanced sheets, tight access to some types of credit, and lingering pessimism about job and income prospects. With increases in spending outpacing growth in income so far this year, the personal saving rate continued to decline, on net, though it remained well above levels that prevailed before the recession (figure 4).
Figure 3. Change in Real Personal Consumption Expenditures, 2006-12
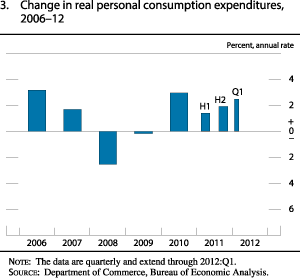
The data are quarterly and extend through 2012:Q1.
Source: Department of Commerce, Bureau of Economic Analysis.
Figure 4. Personal Saving Rate, 1992-2012
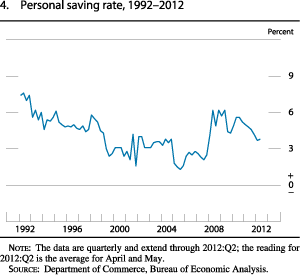
The data are quarterly and extend through 2012:Q2; the reading for 2012:Q2 is the average for April and May.
Source: Department of Commerce, Bureau of Economic Analysis.
Aggregate real disposable personal income (DPI)--personal income less personal taxes, adjusted for changes in prices--rose more rapidly over the first five months of the year than it did in 2011, in part because of declining energy prices (figure 5). The wage and salary component of real DPI, which reflects both the number of hours worked and average hourly wages adjusted for inflation, rose at an annual rate of nearly 1-1/4 percent through May of this year after having increased at a similar pace in 2011. The increase in real wage and salary income so far in 2012 is largely attributable to the modest improvement in employment and hours worked; real average hourly earnings are little changed thus far this year.
Figure 5. Change in Real Disposable Personal Income and in Real Wage and Salary Disbursements, 2006-12
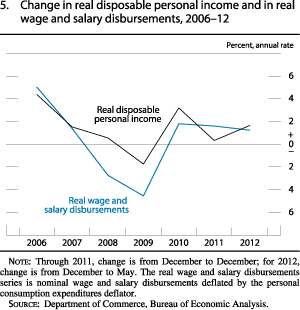
Through 2011, change is from December to December; for 2012, change is from December to May. The real wage and salary disbursements series is nominal wage and salary disbursements deflated by the personal consumption expenditures deflator.
Source: Department of Commerce, Bureau of Economic Analysis.
The ratio of household net worth to income, in the aggregate, moved up slightly further in the first quarter, reflecting increases in both house prices and equity prices (figure 6). Taking a longer view, this ratio has been on a slow upward trend since 2009, and while it remains far below levels seen in the years leading up to the recession, it is about equal to its average over the past 20 years. Household-level data through 2010 indicate that wealth losses were proportionately larger for the middle portion of the wealth distribution--not a surprising result, given the relative importance of housing among the assets of those households. Meanwhile, indicators of consumer sentiment are above their lows from last summer but have yet to return to pre-recession levels (figure 7).
Figure 6. Wealth-to-Income Ratio, 1992-2012
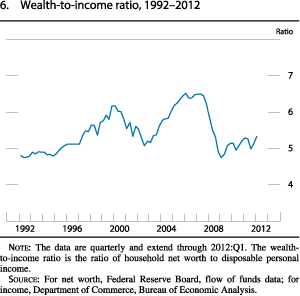
The data are quarterly and extend through 2012:Q1. The wealth-to-income ratio is the ratio of household net worth to disposable personal income.
Source: For net worth, Federal Reserve Board, flow of funds data; for income, Department of Commerce, Bureau of Economic Analysis.
Figure 7. Consumer Sentiment Indexes, 2002-12
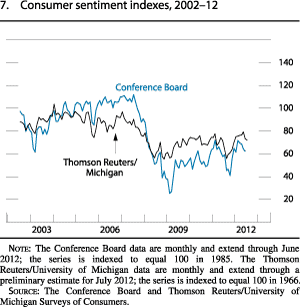
The Conference Board data are monthly and extend through June 2012; the series is indexed to equal 100 in 1985. The Thomson Reuters/University of Michigan data are monthly and extend through a preliminary estimate for July 2012; the series is indexed to equal 100 in 1966.
Source: The Conference Board and Thomson Reuters/University of Michigan Surveys of Consumers.
Household debt--the sum of mortgage and consumer debt--edged down again in the first quarter of 2012 as the continued contraction in mortgage debt was almost offset by solid expansion in consumer credit. With the reduction in household debt, low level of most interest rates, and modest growth of income, the debt-service ratio--the aggregate required principal and interest payments on existing household debt relative to income--decreased further, and, at the end of the first quarter, it stood at a level last seen in 1994 (figure 8).
Figure 8. Household Debt Service, 1984-2012
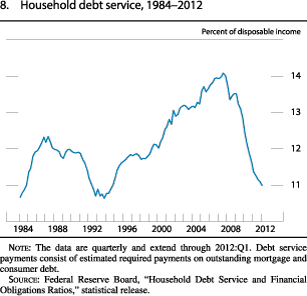
The data are quarterly and extend through 2012:Q1. Debt service payments consist of estimated required payments on outstanding mortgage and consumer debt.
Source: Federal Reserve Board, "Household Debt Service and Financial Obligations Ratios," statistical release.
Consumer credit expanded at an annual rate of about 6-1/4 percent in the first five months of 2012, driven by an increase in nonrevolving credit. This component accounts for about two-thirds of total consumer credit and primarily consists of auto and student loans. The rise in nonrevolving credit so far this year was primarily due to the strength in student loans, which were almost entirely originated and funded by the federal government. Meanwhile, auto loans maintained a steady pace of increase. Revolving consumer credit (primarily credit card lending) remained much more subdued in the first five months of the year in part because nonprime borrowers continued to face tight underwriting standards. Overall, the increase in consumer credit is consistent with recent responses to the Senior Loan Officer Opinion Survey on Bank Lending Practices (SLOOS) indicating that demand had strengthened and standards had eased, on net, for all consumer loan categories.1
Interest rates on consumer loans generally edged down in the first half of 2012, and spreads on these loans relative to Treasury securities of comparable maturity held fairly steady. In particular, interest rates on new auto loans continued to be quite low. However, the spread of rates on credit card loans relative to the two-year Treasury yield has remained wide since the end of 2008 in part because of pricing adjustments made in response to provisions included in the Credit Card Accountability Responsibility and Disclosure Act of 2009.2
Aggregate indicators of consumer credit quality improved further in the first quarter of 2012. The delinquency rate on credit card loans registered its lowest level since the series began in 1991. The recent improvement importantly reflects an ongoing compositional shift in total credit card balances toward borrowers with higher credit scores, due in part to tighter lending standards. Charge-offs on credit card loans also declined, reaching levels last seen at the end of 2007. Delinquencies and charge-offs on nonrevolving consumer loans at commercial banks also edged lower, to levels slightly below their historical averages. In addition, the delinquency rate on auto loans at finance companies decreased slightly to a level that is near the middle of its historical range.
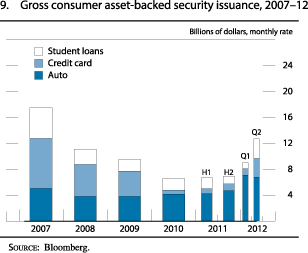
Issuance of consumer asset-backed securities (ABS) in the first half of 2012 exceeded issuance for the same period in 2011 but was still below pre-crisis levels (figure 9). Issuances of securities backed by auto loans dominated the market for most of the first half, while student loan ABS issuance was about the same as in the past two years. In contrast, issuance of credit card ABS remained weak for most of the first half of 2012 as growth of credit card loans continued to be somewhat subdued and most major banks have chosen to fund such loans on their balance sheets. Yields on ABS and their spreads over comparable-maturity swap rates were little changed, on net, over the first half of 2012 and held steady in the low ranges that have prevailed since early 2010.
Figure 9. Gross Consumer Asset-Backed Security Issuance, 2007-12
Source: Bloomberg.
Housing Activity and Housing Finance
Activity in the housing sector appears to be on a gradual uptrend, albeit from a very depressed level. Sales of new and existing homes have risen so far this year, likely supported by the low level of house prices and by low interest rates for conventional mortgages. Nonetheless, the factors that have restrained demand for owner-occupied housing in recent years have yet to dissipate. Many potential buyers are reluctant to purchase homes because of ongoing concerns about future income, employment, and the direction of house prices. In addition, tight mortgage finance conditions preclude many borrowers from obtaining mortgage credit. Much of the home purchase demand that does exist has been channeled to the abundant stock of vacant houses, thereby limiting the response of new construction activity to such expansion of demand as has occurred. Given the large numbers of properties still in, or at risk of being in, foreclosure, this overhang seems likely to continue to weigh on new construction activity for some time.
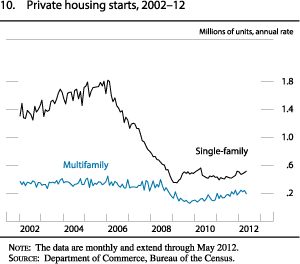
Despite these factors, housing starts have risen gradually so far this year (figure 10). From January to May, single-family houses were started at an annual rate of about 495,000 units, up from 450,000 in the second half of 2011 but less than half of the average pace of the past 50 years. Although the unseasonably warm winter may have contributed to the increase, the underlying pace of activity likely rose some as well. Indeed, data on single-family permit issuance, which is less likely to be affected by weather, also moved up a little from its level late last year. In the multifamily sector, demand has remained robust, as many individuals and families that are unable or unwilling to purchase homes have sought out rental units. As a result, the vacancy rate for rental housing has fallen to its lowest level since 2002, putting upward pressure on rents and spurring new construction. Over the first five months of the year, new multifamily projects were started at an average annual rate of about 225,000 units, up from about 200,000 in the second half of 2011 but still below the 300,000-unit rate that prevailed for much of the previous decade.
Figure 10. Private Housing Starts, 2002-12
The data are monthly and extend through May 2012.
Source: Department of Commerce, Bureau of the Census.
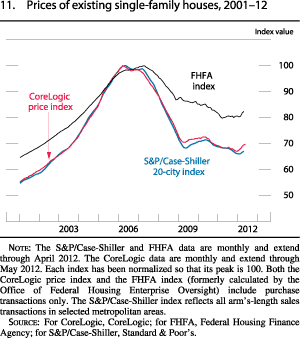
House prices, as measured by several national indexes, turned up in recent months after edging down further, on balance, in 2011 (figure 11). For example, the CoreLogic repeat-sales index rose 4 percent (not an annual rate) over the first five months of the year. This recent improvement notwithstanding, this measure of house prices remains 30 percent below its peak in 2006. The same factors that are restraining single-family housing construction also continue to weigh on house prices, including the large inventory of vacant homes, tight mortgage credit conditions, and lackluster demand.
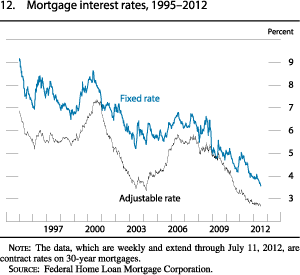
Mortgage rates declined to historically low levels during the first half of 2012 (figure 12). While significant, the drop in mortgage rates generally did not keep pace with the declines in the yields on Treasury and mortgage-backed securities (MBS), probably reflecting still-elevated risk aversion and some capacity constraints among mortgage originators. Despite the drop in mortgage rates, many potentially creditworthy borrowers have had difficulty obtaining mortgages or refinancing because of tight standards and terms (see the box "The Supply of Mortgage Credit The Supply of Mortgage Credit "). Another factor impeding the ability of many borrowers to refinance, or to sell their home and purchase a new one, has been the prevalence of underwater mortgages. Overall, refinancing activity increased in the second quarter but was still less than might be expected, given the level of interest rates, and the pace of mortgage applications for home purchases remained sluggish. However, refinancing activity attributed to recent changes to the HARP--one of which eliminated caps on loan-to-value ratios for those who were refinancing mortgages already owned by government-sponsored enterprises (GSEs)--has picked up over the first half of the year.
Figure 11. Prices of Existing Single-Family Houses, 2001-12
The S&P/Case-Shiller and FHFA data are monthly and extend through April 2012. The CoreLogic data are monthly and extend through May 2012. Each index has been normalized so that its peak is 100. Both the CoreLogic price index and the FHFA index (formerly calculated by the Office of Federal Housing Enterprise Oversight) include purchase transactions only. The S&P/Case-Shiller index reflects all arm's-length sales transactions in selected metropolitan areas.
Source: For CoreLogic, CoreLogic; for FHFA, Federal Housing Finance Agency; for S&P/Case-Shiller, Standard & Poor's.
Figure 12. Mortgage Interest Rates, 1995-2012
The data, which are weekly and extend through July 11, 2012, are contract rates on 30-year mortgages.
Source: Federal Home Loan Mortgage Corporation.
The Supply of Mortgage Credit
Access to mortgage credit is among the important factors that affect the demand for housing and thus the recovery in the housing sector. Lending standards appear to be considerably tighter than they were even before the housing boom, likely preventing many households from purchasing homes.
According to the Senior Loan Officer Opinion Survey on Bank Lending Practices (SLOOS), from mid-2007 into 2009, many lenders tightened their standards for residential mortgages originated to borrowers with prime credit scores, and very few have eased standards since then (figure A). Moreover, the market for nontraditional mortgages continues to be impaired, while the market for subprime mortgages remains effectively closed. Similarly, the range of credit scores on newly originated prime mortgages has remained elevated since lenders shifted toward higher-rated borrowers in 2008 (figure B). The upward shift in credit scores is also evident for prime borrowers who refinanced their mortgages and for Federal Housing Administration mortgages.
Accessible Version of Figure A
Accessible Version of Figure B
Mortgage credit standards were clearly too lax in the middle of the previous decade, and some tightening of lending policies was warranted. Nonetheless, industry data indicate that only about one-half of lenders currently even so much as offer a mortgage to borrowers with credit scores and loan-to-value ratios toward the lower ends of the ranges allowed by the government-sponsored enterprises (GSEs) Fannie Mae and Freddie Mac. That fraction has improved only slightly from 2010.
Respondents to the April SLOOS were asked to identify reasons for their lack of willingness to originate some GSE-eligible mortgages. The factor most frequently cited as "most important" or "very important" was the elevated risk of "putbacks" of delinquent mortgages by the GSEs--that is, the possibility that the GSEs might require originators to repurchase loans with any underwriting irregularities--suggesting that the incomplete transfer of credit risk to the GSEs is an important consideration. Two other factors were cited as most important or very important by almost one-half of respondents: (1) issues related to private mortgage insurance, including the greater difficulty that borrowers faced in obtaining coverage or the higher premiums that they paid for it, and (2) the outlook for house prices. Greater concern about their bank's existing exposure to residential real estate loans and increased concerns about effects of legislative changes, supervisory actions, or changes in accounting standards were also cited relatively frequently as very important factors.
An additional constraint hindering households' access to mortgage credit is negative equity that has resulted from the decline in house prices in recent years. Roughly one in four mortgage borrowers is underwater on his or her mortgage--nearly 13 million households in all. Underwater borrowers are restricted in their ability to refinance into a lower mortgage rate; they may also find their mobility limited by the difficulty of selling their current home.
Indicators of credit quality in the residential mortgage sector continued to reflect strains on homeowners confronting depressed home values and high unemployment. The fraction of current prime mortgages becoming delinquent remained at a high level but inched lower, on net, over the first five months of the year, likely reflecting in part stricter underwriting of more-recent originations. Additionally, measures of late-stage mortgage delinquency, such as the inventory of properties in foreclosure, continued to linger near the peak in the first quarter of 2012 (figure 13).
Figure 13. Current Prime Mortgages Becoming Delinquent and Foreclosure Inventory, 2000-12: Prime Mortgages
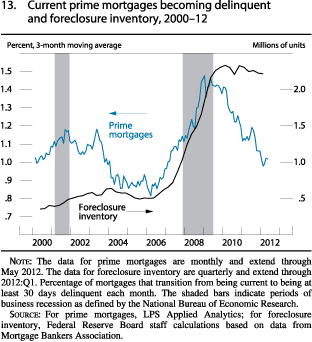
The data for foreclosure inventory are quarterly and extend through 2012:Q1. The shaded bars indicate periods of business recession as defined by the National Bureau of Economic Research (2001:Q1-2001:Q4, 2007:Q4-2009:Q2).
Source: Federal Reserve Board staff calculations based on data from Mortgage Bankers Association.
Gross issuance of MBS guaranteed by GSEs remained moderate in the first half of 2012, consistent with the slow pace of mortgage originations. In contrast, the securitization market for mortgage loans not guaranteed by a housing-related GSE or the Federal Housing Administration--an important source of funding before the crisis for prime-grade mortgages that exceeded the conforming loan size limit--continued to be essentially closed.
The Business Sector
Fixed Investment
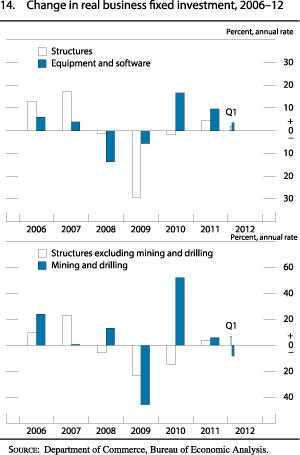
Real business spending for equipment and software (E&S) rose at an annual rate of 3-1/2 percent in the first quarter of 2012 after having risen at a double-digit pace, on average, in the second half of 2011 (figure 14). The slowdown in E&S investment growth in the first quarter was fairly widespread across categories of equipment and software. This deceleration in E&S spending along with the recent softening in indicators of investment demand, such as surveys of business sentiment and capital spending plans, may signal some renewed caution on the part of businesses, perhaps related to the situation in Europe.
Figure 14. Change in Real Business Fixed Investment, 2006-12
Source: Department of Commerce, Bureau of Economic Analysis.
After posting robust gains throughout much of 2011, investment in nonresidential structures edged up in the first quarter of this year. A drop in outlays for drilling and mining structures was probably related to the low level of natural gas prices. Outside of the drilling and mining segments, investment increased at an annual rate of 7 percent in the first quarter, broadly similar to its gain in the fourth quarter of 2011. Although financing conditions for existing properties have eased some, they remain tight; moreover, high vacancy rates, low commercial real estate prices, and difficult financing conditions for new construction will likely weigh on building activity for the foreseeable future.
Inventory Investment
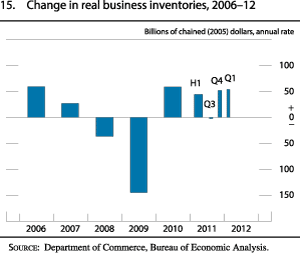
Firms accumulated inventories in the first quarter at about the same pace as in the fourth quarter of last year (figure 15). Motor vehicle inventories surged in the first quarter, as automakers rebuilt dealers' inventories to comfortable levels after natural disasters disrupted global supply chains in 2011. Stockbuilding outside of motor vehicles moderated somewhat from the fourth-quarter pace of accumulation. Inventory-to-sales ratios for most industries covered by the Census Bureau's book-value data, as well as surveys of private inventory satisfaction and plans, generally suggest that stocks are fairly well aligned with the pace of sales.
Figure 15. Change in Real Business Inventories, 2006-12
Source: Department of Commerce, Bureau of Economic Analysis.
Corporate Profits and Business Finance
Aggregate operating earnings per share for S&P 500 firms rose about 7 percent at a seasonally adjusted quarterly rate in the first quarter of 2012. Financial firms accounted for most of the gain, while profits for firms in the nonfinancial sector were about unchanged from the high level seen in the fourth quarter of last year. As of the end of June, private-sector analysts projected moderate earnings growth through the end of the year.
The ratio of corporate profits to gross national product in the first quarter of 2012 hovered around its historical high, and cash flow remained solid. In addition, the ratio of liquid assets to total assets continued to be near its highest level in more than 20 years, and the share of corporate cash flow needed to cover interest expenses remained low. Against this backdrop of generally strong corporate earnings and balance sheets, credit rating upgrades continued to outpace downgrades for nonfinancial corporations, and the bond default rate for nonfinancial firms remained low in the first half of the year. The delinquency rate on commercial and industrial (C&I) loans decreased further in the first quarter and approached the lower end of its historical range.
With corporate credit quality remaining robust, nonfinancial firms were able to continue to raise funds at a generally strong pace in the first half of the year (figure 16). So far this year, nonfinancial commercial paper (CP) outstanding was about unchanged. Bond issuance by both investment- and speculative-grade nonfinancial firms was strong over the first four months of the year, but speculative-grade issuance weakened some in May and notably further in June. The institutional segment of the syndicated leveraged loan market remained solid in the first half of the year, reportedly supported by continued demand for loans from nonbank investors, such as pension plans and insurance companies (figure 17). In addition, the volume of newly established collateralized loan obligations so far this year has already surpassed 2011 levels. Much of the bond and loan issuance was reportedly used to refinance, and likely also to extend the maturity of, existing debt, given the low level of long-term interest rates.
Figure 16. Selected Components of Net Financing for Nonfinancial Businesses, 2005-12
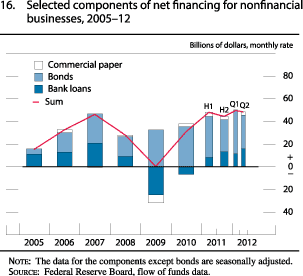
The data for the components except bonds are seasonally adjusted.
Source: Federal Reserve Board, flow of funds data.
Figure 17. Issuance of Institutional Leveraged Loans, 2006-12
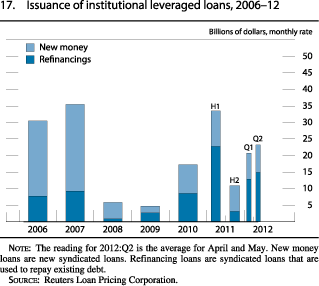
The reading for 2012:Q2 is the average for April and May. New money loans are new syndicated loans. Refinancing loans are syndicated loans that are used to repay existing debt.
Source: Reuters Loan Pricing Corporation.
C&I loans outstanding at commercial banking organizations in the United States expanded at a brisk pace in the first half of 2012 despite declines in the holdings of such loans by U.S. branches and agencies of European institutions. The strength is consistent with a relatively large number of banks, on balance, that have reported stronger demand for C&I loans in the recent SLOOS (figure 18). Moreover, in the April SLOOS, banks continued to report having eased both price and nonprice terms for C&I loans, largely in response to strong competition from other banks and nonbank lenders. The extent of easing generally has been greater for large and middle-market firms. That said, according to the Survey of Terms of Business Lending (STBL), spreads on C&I loans over banks' cost of funds, while continuing to trend down gradually in the February and May surveys, are still quite high in historical terms. Spreads on newly issued syndicated loans have also remained somewhat wide.
Borrowing conditions for small businesses generally have improved over the past few years but have done so much more gradually than have conditions for larger firms; moreover, the demand for credit from small firms apparently remains subdued. C&I loans with original amounts of $1 million or less--a large share of which likely consists of loans to small businesses--were about unchanged in the first quarter.3 According to results from surveys conducted by the National Federation of Independent Business during the first half of this year, the fraction of firms with borrowing needs stayed low (figure 19). The net percentage of respondents that found credit more difficult to obtain than three months earlier and that expected tighter credit conditions over the next three months have both declined, but they remained at relatively high levels in the June survey. In addition, recent readings from the STBL indicate that the spreads charged by commercial banks on newly originated C&I loans with original amounts less than $1 million remained quite high, even on loans with the strongest credit ratings.
Figure 18. Change in Standards and Demand for Commercial and Industrial Loans, 1991-2012
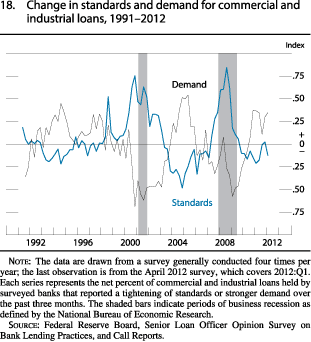
The data are drawn from a survey generally conducted four times per year; the last observation is from the April 2012 survey, which covers 2012:Q1. Each series represents the net percent of commercial and industrial loans held by surveyed banks that reported a tightening of standards or stronger demand over the past three months. The shaded bars indicate periods of business recession as defined by the National Bureau of Economic Research (2001:Q1-2001:Q4, 2007:Q4-2009:Q2).
Source: Federal Reserve Board, Senior Loan Officer Opinion Survey on Bank Lending Practices, and Call Reports.
Figure 19. Net Percentage of Firms with Borrowing Needs, 1994-2012
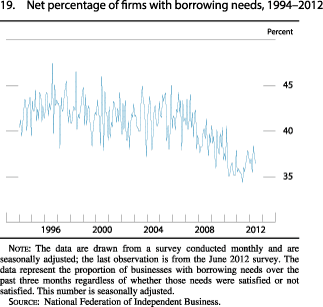
The data are drawn from a survey conducted monthly and are seasonally adjusted; the last observation is from the June 2012 survey. The data represent the proportion of businesses with borrowing needs over the past three months regardless of whether those needs were satisfied or not satisfied. This number is seasonally adjusted.
Source: National Federation of Independent Business.
Financial conditions in the commercial real estate (CRE) sector have eased some but stayed relatively tight amid weak fundamentals. According to the April SLOOS, some domestic banks reported having eased standards on CRE loans and, on balance, a significant number of domestic banks reported increased demand for such loans. While banks' holdings of CRE loans continued to contract in the first half of this year, they did so at a slower pace than in the second half of last year. The weakest segment of CRE lending has been the portion supporting construction and land development; some other segments have recently expanded modestly. Issuance of commercial mortgage-backed securities (CMBS) has also increased recently from the low levels observed last year. Nonetheless, the delinquency rate on loans in CMBS pools continued to set new highs in June, as some five-year loans issued in 2007 at the height of the market were unable to refinance at maturity because of their high loan-to-value ratios (figure 20). While delinquency rates for CRE loans at commercial banks improved slightly in the first quarter, they remained elevated, especially for construction and land development loans.
In the corporate equity market, gross public equity issuance by nonfinancial firms was strong in the first five months of 2012, boosted by a solid pace of initial public offerings (IPOs).4 Data for the first quarter of 2012 indicate that share repurchases and cash-financed mergers by nonfinancial firms remained robust, and net equity issuance remained deeply negative (figure 21). However, fewer mergers and new share repurchase programs were announced in the second quarter.
Figure 20. Delinquency Rates on Commercial Real Estate Loans, 1991-2012
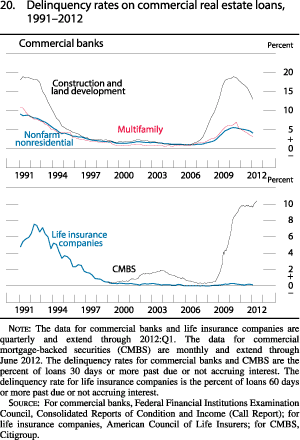
The data for commercial banks and life insurance companies are quarterly and extend through 2012:Q1. The data for commercial mortgage-backed securities (CMBS) are monthly and extend through June 2012. The delinquency rates for commercial banks and CMBS are the percent of loans 30 days or more past due or not accruing interest. The delinquency rate for life insurance companies is the percent of loans 60 days or more past due or not accruing interest.
Source: For commercial banks, Federal Financial Institutions Examination Council, Consolidated Reports of Condition and Income (Call Report); for life insurance companies, American Council of Life Insurers; for CMBS, Citigroup.
Figure 21. Components of Net Equity Issuance, 2005-12
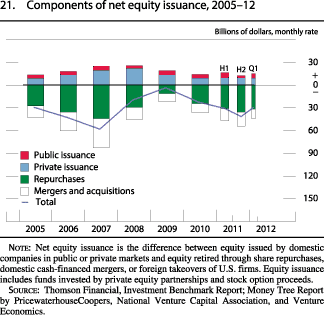
Net equity issuance is the difference between equity issued by domestic companies in public or private markets and equity retired through share repurchases, domestic cash-financed mergers, or foreign takeovers of U.S. firms. Equity issuance includes funds invested by private equity partnerships and stock option proceeds.
Source: Thomson Financial, Investment Benchmark Report; Money Tree Report by PricewaterhouseCoopers, National Venture Capital Association, and Venture Economics.
The Government Sector
Federal Government
The deficit in the federal unified budget remains elevated. The Congressional Budget Office projects that the deficit for fiscal year 2012 will be close to $1.2 trillion, or about 7-1/2 percent of nominal GDP. Such a deficit would be a narrower share of GDP than those recorded over the past several years though still sharply higher than those recorded in the few years prior to the onset of the financial crisis and recession. The narrowing of the budget deficit expected to occur in the current fiscal year mostly reflects increases in tax revenues as the economy continues to recover, although the growth in outlays is being held back by the winding down of expansionary fiscal policies enacted in response to the recession, as well as some budgetary restraint in defense and other discretionary spending programs.
Federal receipts increased 5 percent in the first nine months of fiscal 2012 compared with the same period in fiscal 2011. Receipts were bolstered thus far this fiscal year by a robust rise in corporate tax revenues that is largely attributable to a scaling back in the favorable tax treatment of some business investment. In addition, individual income and payroll tax receipts have moved higher, reflecting increases in nominal wage and salary income. Nonetheless, at only about 15-1/2 percent, the ratio of federal receipts to national income is near the lowest reading for this ratio over the past 60 years (figure 22).
Figure 22. Federal Receipts and Expenditures, 1992-2012
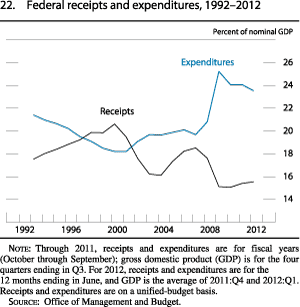
Through 2011, receipts and expenditures are for fiscal years (October through September); gross domestic product (GDP) is for the four quarters ending in Q3. For 2012, receipts and expenditures are for the 12 months ending in June, and GDP is the average of 2011:Q4 and 2012:Q1. Receipts and expenditures are on a unified-budget basis.
Source: Office of Management and Budget.
Total federal outlays moved sideways in the first nine months of fiscal 2012 relative to the comparable year-earlier period. Outlays were reduced by the winding down of stimulus-related programs (including the American Recovery and Reinvestment Act of 2009), lower payments for unemployment insurance, and falling defense expenditures. In addition, outlays for Medicaid so far this fiscal year were unusually weak, apparently reflecting in part the implementation of cost-containment measures by many state governments to reduce spending growth for that program. In contrast, Social Security outlays rose in part because of the first cost-of-living adjustments since 2009, and outlays for financial transactions were boosted by the revaluation of the expected cost of previous Troubled Asset Relief Program transactions and an increase in net outlays for deposit insurance.5 Net interest payments increased moderately, reflecting the rising level of the federal debt.
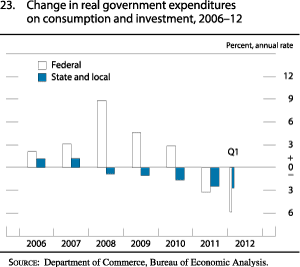
As measured in the national income and product accounts (NIPA), real federal expenditures on consumption and gross investment--the part of federal spending included in the calculation of GDP--fell at an annual rate of close to 6 percent in the first quarter (figure 23). Defense spending, which tends to be erratic from quarter to quarter, contracted more than 8 percent, and nondefense purchases edged down.
Federal debt held by the public rose to about 72 percent of nominal GDP in the second quarter of 2012, 3-1/2 percentage points higher than at the end of last year (figure 24). Treasury auctions generally continued to be well received by investors. Indicators of demand at Treasury auctions, such as bid-to-cover ratios and indirect bidding ratios, were within their historical ranges.
Figure 23. Change in Real Government Expenditures on Consumption and Investment, 2006-12
Source: Department of Commerce, Bureau of Economic Analysis.
Figure 24. Federal Government Debt Held by the Public, 1960-2012
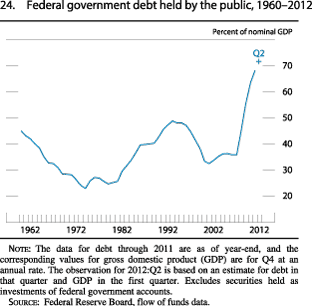
The data for debt through 2011 are as of year-end, and the corresponding values for gross domestic product (GDP) are for Q4 at an annual rate. The observation for 2012:Q2 is based on an estimate for debt in that quarter and GDP in the first quarter. Excludes securities held as investments of federal government accounts.
Source: Federal Reserve Board, flow of funds data.
State and Local Government
State and local government budgets remain strained, but overall fiscal conditions for these governments may be slowly improving. In particular, state and local tax receipts appeared to increase moderately over the first half of this year. Census Bureau data indicate that state revenue collections rose 4 percent in the first quarter relative to a year earlier, and anecdotal evidence suggests that collections during April and May were well maintained. Moreover, only a few states reported budget shortfalls during fiscal 2012 (which ended on June 30 in most states). The improvement is less evident at the local level, where property tax receipts--the largest source of tax revenue for these governments--were roughly flat in 2011 and early 2012, reflecting the crosscutting effects of the earlier declines in home prices and increases in property tax rates. Moreover, federal aid to both state and local governments has declined as stimulus-related grants have been almost completely phased out.
One of the ways that state and local governments have addressed their tight budget situations has been through cuts in their employment and construction spending. After shedding jobs at an average pace of 19,000 per month in 2011, these governments reduced their employment over the first half of the year at a slower pace by trimming 3,000 jobs per month on average. However, real construction expenditures fell sharply in the first quarter after having edged down in the latter half of 2011, and available information on nominal construction spending through May points to continued declines in recent months. The decreases in employment and construction are evident in the Bureau of Economic Analysis (BEA) estimate for real state and local purchases, which fell at an annual rate of 2-3/4 percent in the first quarter, about the same pace as in 2011.
Gross issuance of bonds by states and municipalities picked up in the second quarter of 2012. Credit quality in the sector continued to deteriorate over the first half of the year. For instance, credit rating downgrades by Moody's Investors Service substantially outpaced upgrades, and credit default swap (CDS) indexes for municipal bonds rose on net. Yields on long-term general obligation municipal bonds were about unchanged over the first half of the year.
The External Sector
Exports and Imports
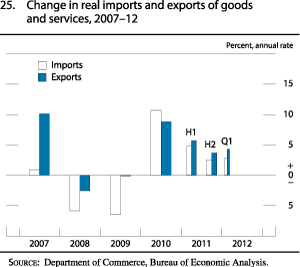
Both real exports and imports grew moderately in the first quarter of 2012 (figure 25). Real exports of goods and services rose at an annual rate of 4-1/4 percent, supported by relatively strong foreign economic growth. Exports of services, automobiles, computers, and aircraft expanded rapidly, while those of consumer goods declined. The rise in exports was particularly strong to Canada and Mexico. Data for April and May suggest that exports continued to rise at a moderate pace in the second quarter.
Figure 25. Change in Real Imports and Exports of Goods and Services, 2007-12
Source: Department of Commerce, Bureau of Economic Analysis.
Real imports of goods and services rose a relatively modest 2-3/4 percent in the first quarter, reflecting slower growth in U.S. economic activity. Imports of services, automobiles, and computers rose significantly, while those of petroleum, aircraft, and consumer goods fell. The rise in imports was broadly based across major trading partners, with imports from Japan and Mexico showing particularly strong growth. April and May data suggest that import growth picked up in the second quarter.
Altogether, net exports made a small positive contribution of one-tenth of 1 percentage point to real GDP growth in the first quarter.
Commodity and Trade Prices
After increasing earlier in the year, oil prices have subsequently fallen back (figure 26). Over much of the first quarter, an improved outlook for the global economy and increased geopolitical tensions--most notably with Iran--helped spur a run-up in the spot price of oil, with the Brent benchmark averaging $125 per barrel in March, about $15 above its January average. Since mid-March, however, oil prices have more than retraced their earlier gains amid an intensification of the crisis in Europe and increased concerns over the strength of economic growth in China. An easing of geopolitical tensions and increased crude oil supply--production by Saudi Arabia has been running at near-record high levels--have also likely contributed to the decline in oil prices. All told, the price of Brent has plunged $25 a barrel from March to about $100 per barrel in mid-July.
Figure 26. Prices of Oil and Nonfuel Commodities, 2007-12
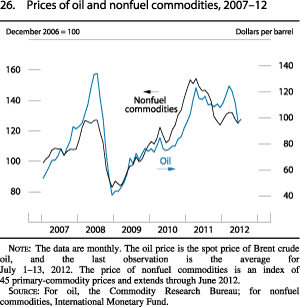
The data are monthly. The oil price is the spot price of Brent crude oil, and the last observation is the average for July 1-13, 2012. The price of nonfuel commodities is an index of 45 primary-commodity prices and extends through June 2012.
Source: For oil, the Commodity Research Bureau; for nonfuel commodities, International Monetary Fund.
Prices of many nonfuel commodities followed a path similar to that shown by oil prices, albeit with less volatility. Early in 2012, commodity prices rallied, as global economic prospects and financial conditions improved along with a temporary abatement of stresses in Europe. However, as with oil prices, broader commodity prices fell in the second quarter, reflecting growing pessimism regarding prospects for the global economy.
Prices for non-oil imported goods increased less than 1/4 percent in the first quarter, with the modest pace of increase likely reflecting the lagged effects of both the appreciation of the dollar and the decline in commodity prices that occurred late last year. Moving into the second quarter, import price inflation appears to have remained subdued, consistent with a further appreciation of the dollar.
The Current and Financial Accounts
Largely reflecting the run-up in oil prices early in the year, the nominal trade deficit widened slightly in the first quarter (figure 27). In addition, as the net investment income balance continued to decline, the current account deficit deteriorated from an annual average of $470 billion in 2011 to $550 billion in the first quarter, or 3-1/2 percent of GDP.6
The financial flows that provide the financing of the current account deficit reflected the general trends in financial market sentiment and in reserve accumulation by emerging market economies (EMEs). Consistent with a temporary improvement in the tone of financial markets in the first quarter, foreign private investors slowed their net purchases of U.S. Treasury securities and resumed net purchases of U.S. equities, although they continued to sell other U.S. bonds (figure 28). However, the tentative increase in foreign risk appetite abated early in the second quarter and foreign private investors showed renewed demand for U.S. Treasury securities and less demand for other U.S. securities.
Figure 27. U.S. Trade and Current Account Balances, 2004-12
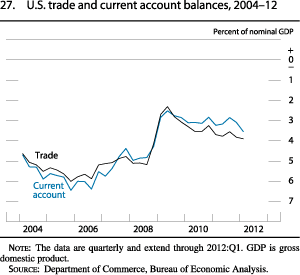
The data are quarterly and extend through 2012:Q1. GDP is gross domestic product.
Source: Department of Commerce, Bureau of Economic Analysis.
Figure 28. Net Foreign Purchases of U.S. Securities, 2008-12
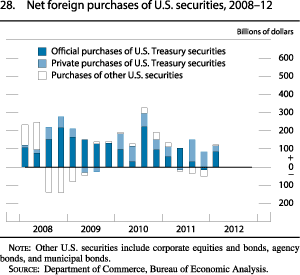
Other U.S. securities include corporate equities and bonds, agency bonds, and municipal bonds.
Source: Department of Commerce, Bureau of Economic Analysis.
U.S. investors' demand for foreign securities was flat, on net, in the first quarter and the early part of the second quarter, but this outcome nonetheless represents an increase relative to net sales of foreign securities in the fourth quarter of 2011 (figure 29).
Inflows from foreign official institutions strengthened in the first quarter as emerging market governments bought dollars to counter upward pressure on their currencies, resulting in increased accumulation of dollar-denominated reserves, which were then invested in U.S. securities (figure 30). Partial data for the second quarter suggest that foreign official inflows remained strong despite renewed dollar appreciation against emerging market currencies. U.S. official assets registered a $51 billion inflow during the first quarter as drawings on the Federal Reserve's dollar swap lines with the European Central Bank (ECB) and the Bank of Japan (BOJ) were partially repaid.
Figure 29. Net U.S. Purchases of Foreign Securities, 2008-12
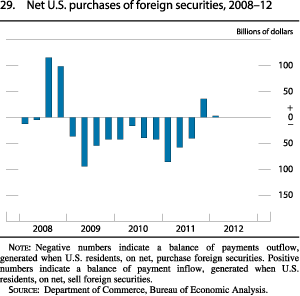
Negative numbers indicate a balance of payments outflow, generated when U.S. residents, on net, purchase foreign securities. Positive numbers indicate a balance of payment inflow, generated when U.S. residents, on net, sell foreign securities.
Source: Department of Commerce, Bureau of Economic Analysis.
Figure 30. U.S. Net Financial Inflows, 2008-12
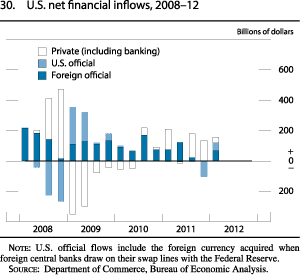
U.S. official flows include the foreign currency acquired when foreign central banks draw on their swap lines with the Federal Reserve.
Source: Department of Commerce, Bureau of Economic Analysis.
National Saving
Total U.S. net national saving--that is, the saving of U.S. households, businesses, and governments, net of depreciation charges--remains extremely low by historical standards (figure 31). Net national saving fell from 4 percent of nominal GDP in 2006 to negative 2 percent in 2009, as the federal budget deficit widened. The national saving rate subsequently increased to near zero, where it remained as of the first quarter of 2012 (the latest quarter for which data are available). The relative flatness of the saving rate over the past couple of years reflects the offsetting effects of a narrowing in the federal budget deficit as a share of nominal GDP and a downward movement in the private saving rate. National saving will likely remain low this year in light of the continuing large federal budget deficit. A portion of the decline in federal savings relative to pre-crisis levels is cyclical and would be expected to reverse as the economy recovers. However, if low levels of national saving persist over the longer run, they will likely be associated with both low rates of capital formation and heavy borrowing from abroad, limiting the rise in the standard of living for U.S. residents over time.
Figure 31. Net Saving, 1992-2012
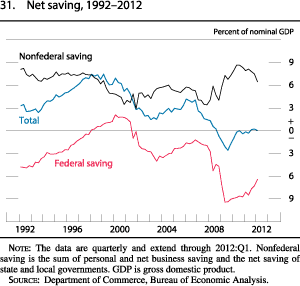
The data are quarterly and extend through 2012:Q1. Nonfederal saving is the sum of personal and net business saving and the net saving of state and local governments. GDP is gross domestic product.
Source: Department of Commerce, Bureau of Economic Analysis.
The Labor Market
Employment and Unemployment
Labor market conditions remain weak. After averaging 165,000 jobs per month in the second half of 2011, private payroll employment gains increased to 225,000 jobs per month over the first three months of the year and then fell back to 90,000 jobs per month over the past three months (figure 32). The apparent slowing in the pace of net job creation may have been exaggerated by issues related to swings in the weather and to seasonal adjustment difficulties associated with the timing of the sharpest job losses during the recession. Moreover, employment gains during the second half of last year and into the early part of this year may have reflected some catch-up in hiring on the part of employers that aggressively pared their workforces during and just after the recession. The recent deceleration in employment may suggest that much of this catch-up has now taken place and that, consequently, more-rapid gains in economic activity will be required to achieve significant further increases in employment and declines in the unemployment rate.
The unemployment rate, though down from around 9 percent last summer, has held about flat at 8-1/4 percent since early this year and remains elevated relative to levels observed prior to the recent recession (figure 33). Moreover, long-term unemployment also remains elevated. In June, around 40 percent of those unemployed had been out of work for more than six months (figure 34). Meanwhile, the labor force participation rate has fluctuated around a low level so far this year after having moved down 2 percentage points since 2007.
Figure 32. Net Change in Private Payroll Employment, 2006-12
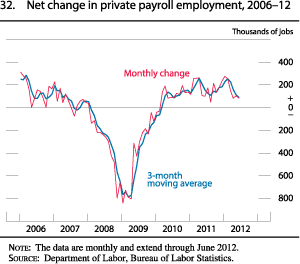
The data are monthly and extend through June 2012.
Source: Department of Labor, Bureau of Labor Statistics.
Figure 33. Civilian Unemployment Rate, 1982-2012
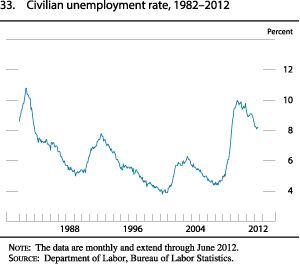
The data are monthly and extend through June 2012.
Source: Department of Labor, Bureau of Labor Statistics.
Figure 34. Long-Term Unemployed, 2006-12
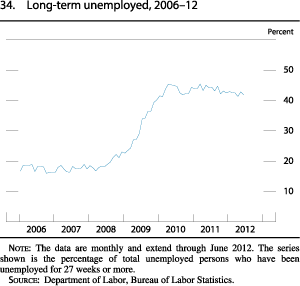
The data are monthly and extend through June 2012. The series shown is the percentage of total unemployed persons who have been unemployed for 27 weeks or more.
Source: Department of Labor, Bureau of Labor Statistics.
Other labor market indicators were consistent with little change in overall labor market conditions during the first half of the year. Initial claims for unemployment insurance were not much changed, on net, although their average level over the first half of the year was lower than in the second half of 2011. Measures of job vacancies edged up, on balance, and households' labor market expectations largely reversed the steep deterioration from last summer. However, indicators of hiring activity remained subdued.
Productivity and Labor Compensation
Gains in labor productivity have continued to slow recently following an outsized increase in 2009 and a solid gain in 2010. According to the latest published data, output per hour in the nonfarm business sector rose just 1/2 percent in 2011 and declined in the first quarter of 2012 (figure 35). Although these data can be volatile from quarter to quarter, the moderation in productivity growth over the past two years suggests that firms have been adding workers not only to meet rising production needs but also to relieve pressures on their existing workforces, which were cut back sharply during the recession.
Increases in hourly compensation continue to be restrained by the very weak condition of the labor market. The 12-month change in the employment cost index for private industry workers, which measures both wages and the cost to employers of providing benefits, has been about 2 percent or less since the start of 2009 after several years of increases in the neighborhood of 3 percent (figure 36). Nominal compensation per hour in the nonfarm business sector--a measure derived from the labor compensation data in the NIPA--also decelerated significantly over the past few years; this measure rose just 1-1/4 percent over the year ending in the first quarter of 2012, well below the average increase of about 4 percent in the years before the recession. Similarly, average hourly earnings for all employees--the timeliest measure of wage developments--rose about 2 percent in nominal terms over the 12 months ending in June. According to each of these measures, gains in hourly compensation failed to keep up with increases in consumer prices in 2011 and again in the first quarter of this year.
Figure 35. Change in Output per Hour, 1948-2012
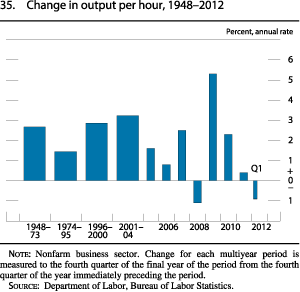
Nonfarm business sector. Change for each multiyear period is measured to the fourth quarter of the final year of the period from the fourth quarter of the year immediately preceding the period.
Source: Department of Labor, Bureau of Labor Statistics.
Figure 36. Measures of Change in Hourly Compensation, 2002-12
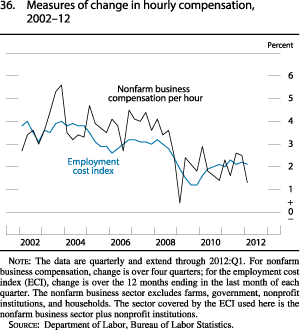
The data are quarterly and extend through 2012:Q1. For nonfarm business compensation, change is over four quarters; for the employment cost index (ECI), change is over the 12 months ending in the last month of each quarter. The nonfarm business sector excludes farms, government, nonprofit institutions, and households. The sector covered by the ECI used here is the nonfarm business sector plus nonprofit institutions.
Source: Department of Labor, Bureau of Labor Statistics.
The change in unit labor costs faced by firms--which measures the extent to which nominal hourly compensation rises in excess of labor productivity--remained subdued. Unit labor costs in the nonfarm business sector rose 1 percent over the year ending in the first quarter of 2012. Over the preceding year, unit labor costs increased 1-1/2 percent.
Prices
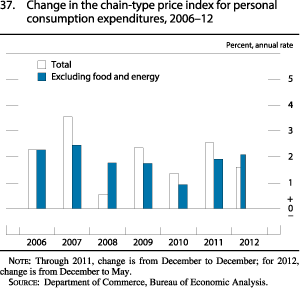
Consumer price inflation moved down, on net, during the first part of 2012. Overall PCE prices rose rapidly in the first three months of the year, reflecting large increases in oil prices, but inflation turned down in the spring as oil prices more than reversed their earlier run-ups. The overall chain-type PCE price index increased at an annual rate of about 1-1/2 percent between December 2011 and May 2012, compared with a rise of 2-1/2 percent over 2011 (figure 37). Excluding food and energy, consumer prices rose at a rate of about 2 percent over the first five months of the year, essentially the same pace as in 2011. In addition to the net decline in crude oil prices over the first half of the year, factors contributing to low consumer price inflation this year include the deceleration of non-oil import prices in the latter part of 2011, subdued labor costs associated with the weak labor market, and stable inflation expectations.
Figure 37. Change in the Chain-Type Price Index for Personal Consumption Expenditures, 2006-12
Through 2011, change is from December to December; for 2012, change is from December to May.
Source: Department of Commerce, Bureau of Economic Analysis.
Consumer energy prices surged at an annual rate of over 20 percent in the first three months of 2012, as higher costs for crude oil were passed through to gasoline prices. In April, the national-average price for gasoline at the pump approached $4 per gallon. Since then, crude oil prices have tumbled, and gasoline prices have declined roughly in line with crude costs, more than reversing the earlier run-up. Consumer prices for natural gas plunged over the first five months of the year after falling late last year; this drop is attributable, at least in part, to the unseasonably warm winter, which reduced demand for natural gas. More recently, spot prices for natural gas have turned up as production has been cut back, but they still remain substantially lower than they were last summer.
Consumer food price inflation has slowed noticeably so far this year, as the effect on retail food prices from last year's jump in farm commodity prices appears to have largely dissipated. Indeed, PCE prices for food and beverages only edged up slightly, rising at an annual rate of about 1/2 percent from December to May after increasing more than 5 percent in 2011. Although farm commodity prices were tempered earlier this year by expectations of a substantial increase in crop output this growing season, grain prices rose rapidly in late June and early July as a wide swath of the Midwest experienced a bout of hot, dry weather that farm analysts believe cut yield prospects considerably.
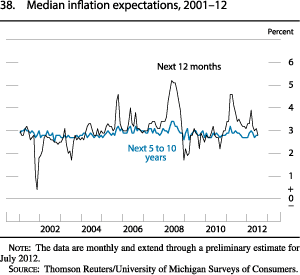
Survey-based measures of near-term inflation expectations have changed little, on net, so far this year. Median year-ahead inflation expectations, as reported in the Thomson Reuters/University of Michigan Surveys of Consumers (Michigan survey), rose in March when gasoline prices were high but then fell back as those prices reversed course (figure 38). Longer-term expectations remained more stable. In the Michigan survey, median expected inflation over the next 5 to 10 years was 2.8 percent in early July, within the narrow range of the past 10 years. In the Survey of Professional Forecasters, conducted by the Federal Reserve Bank of Philadelphia, expectations for the increase in the price index for PCE over the next 10 years remained at 2-1/4 percent, in the middle of its recent range.
Measures of medium- and longer-term inflation compensation derived from nominal and inflation-protected Treasury securities--which not only reflect inflation expectations, but also can be affected by changes in investor risk aversion and by the different liquidity properties of the two types of securities--were little changed, on net, so far this year (figure 39). These measures increased early in the period amid rising prices for oil and other commodities, but they subsequently declined as commodity prices fell back and as worries about domestic and global economic growth increased.
Figure 38. Median Inflation Expectations, 2001-12
The data are monthly and extend through a preliminary estimate for July 2012.
Source: Thomson Reuters/University of Michigan Surveys of Consumers.
Figure 39. Inflation Compensation, 2007-12
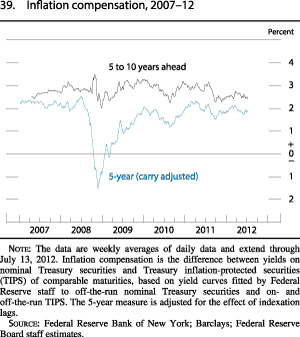
The data are weekly averages of daily data and extend through July 13, 2012. Inflation compensation is the difference between yields on nominal Treasury securities and Treasury inflation-protected securities (TIPS) of comparable maturities, based on yield curves fitted by Federal Reserve staff to off-the-run nominal Treasury securities and on- and off-the-run TIPS. The 5-year measure is adjusted for the effect of indexation lags.
Source: Federal Reserve Bank of New York; Barclays; Federal Reserve Board staff estimates.
Financial Developments
Financial Developments
The Capital and Liquidity Position of Large U.S. Banks
In mid-March, the Federal Reserve announced the results of the Comprehensive Capital Analysis and Review (CCAR) 2012. This program evaluated the capital planning processes and capital adequacy of 19 of the largest banks, a subset of those that will be required to undergo annual stress-testing exercises by the Board of Governors under the Dodd-Frank Wall Street Reform and Consumer Protection Act of 2010 (Dodd-Frank Act).1 These 19 bank holding companies (BHCs) also participated in the 2009 Supervisory Capital Assessment Program and the CCAR in 2011. The supervisory stress tests under CCAR 2012 evaluated whether the banks' proposed capital distribution plans would allow them to maintain sufficient capital to support lending to households and businesses even in the event of an extended period of highly adverse economic and financial conditions. The stress scenario incorporated a peak unemployment rate of 13 percent, a drop in equity prices of more than 50 percent, and a decline in house prices of 21 percent. The results indicated that 15 of the 19 BHCs would continue to meet supervisory expectations for several measures of capital adequacy through the end of 2013 despite large projected losses under this extremely adverse hypothetical scenario, given the firms' proposed capital distribution plans.2
These results reflect the significant steps these BHCs have taken to improve their capital positions over the past three years. In particular, the aggregate Tier 1 common ratio for these 19 firms has doubled from about 5-1/2 percent in the first quarter of 2009 to close to 11 percent in the first quarter of 2012 (figure A). Much of the improvement over the intervening period can be attributed to increased retained earnings and issuance of common stock during a period of limited growth in risk-weighted assets.
The 19 BHCs subject to the CCAR have also reduced their vulnerabilities to disruptions in funding markets. For instance, they have significantly reduced their reliance on short-term wholesale liabilities relative to total assets since the height of the financial crisis (figure B). In addition, these BHCs have experienced significant inflows of relatively stable core deposits, owing in part to the availability of unlimited deposit insurance on noninterest-bearing transaction accounts from the Federal Deposit Insurance Corporation until the end of 2012, as well as the generally high demand for safe and liquid assets in the current environment.
Overall, major U.S. financial institutions are much better positioned to weather an economic downturn while meeting the credit needs of potential borrowers than they were a few years ago, having substantially increased their capital buffers and improved their liquidity positions over the past several years. That said, a significant disruption in global financial markets, such as might occur if the European situation were to worsen markedly, would still pose considerable challenges to the U.S. banking and financial systems.
Footnotes
1. Board of Governors of the Federal Reserve System (2012), Comprehensive Capital Analysis and Review 2012: Methodology and Results for Stress Scenario Projections (Washington: Board of Governors, March 13), www.federalreserve.gov/newsevents/press/bcreg/bcreg20120313a1.pdf. The Dodd-Frank Act requires the Board, in coordination with the appropriate primary financial regulatory agencies and the Federal Insurance Office, to conduct annual analyses of nonbank financial companies supervised by the Board and bank holding companies with total consolidated assets equal to or greater than $50 billion to determine whether such companies have the capital necessary to absorb losses that might result from a period of adverse economic conditions. All other financial companies that have total consolidated assets of more than $10 billion and are regulated by a primary federal financial regulatory agency are required to conduct annual internal stress tests. Smaller community banks are not required to undertake stress tests, but any bank's primary regulator may subject the bank to a stress test if conditions warrant. See Board of Governors of the Federal Reserve System, Division of Banking Supervision and Regulation (2012), "Supervisory Guidance on Stress Testing for Banking Organizations with More Than $10 Billion in Total Consolidated Assets," Supervision and Regulation Letter SR 12-7 (May 14), www.federalreserve.gov/bankinforeg/srletters/sr1207.htm.
2. The development of sound models is crucial to the credibility of any type of stress-testing exercise. As a result, the Federal Reserve has developed formal procedures by which teams of staff members from around the Federal Reserve System validate the supervisory models used by the Federal Reserve during the CCAR process. Furthermore, in April 2012, the Board announced the formation of the Model Validation Council, composed of outside experts, which will provide the Federal Reserve with independent advice on the processes used for model assessment. See Board of Governors of the Federal Reserve System (2012), "Federal Reserve Board Announces the Formation of the Model Validation Council," press release, April 20, www.federalreserve.gov/newsevents/press/bcreg/20120420a.htm.
Monetary Policy Expectations and Treasury Rates
In response to the steps taken by the Federal Open Market Committee (FOMC) to provide additional monetary policy accommodation, and amid growing anxiety about the European crisis and a worsening of the economic outlook, investors pushed out further the date when they expect the federal funds rate to first rise above its current target range of 0 to 1/4 percent. In addition, they apparently scaled back the pace at which they expect the federal funds rate subsequently to be increased. Market participants currently anticipate that the effective federal funds rate will be about 50 basis points by the middle of 2015, roughly 55 basis points lower than they expected at the beginning of 2012.
Yields on longer-term nominal Treasury securities declined, on balance, over the first half of 2012 (figure 40). Early in the year, longer-term Treasury yields rose, reflecting generally positive U.S. economic data, improved market sentiment regarding the crisis in Europe, and higher energy prices. More recently, however, longer-term yields have more than reversed their earlier increases. Investors sought the relative safety and liquidity of Treasury securities as the crisis in Europe intensified again and as weaker-than-expected economic data releases raised concerns about the pace of economic recovery both in the United States and abroad. In addition, those developments fostered expectations that the Federal Reserve would provide additional accommodation. And the Treasury yield curve flattened further following the FOMC's decision at its June meeting to continue the maturity extension program (MEP) through the end of 2012. On balance, yields on 5-, 10-, and 30-year nominal Treasury securities declined roughly 20, 40, and 35 basis points, respectively, from their levels at the start of this year. The Open Market Desk's outright purchases and sales of Treasury securities under the MEP did not appear to have any material adverse effect on Treasury market functioning.
Short-Term Funding Markets
Despite the reemergence of strains in Europe, conditions in unsecured short-term dollar funding markets have remained fairly stable in the first half of 2012. Measures of stress in short-term funding markets have eased somewhat, on balance, since the beginning of the year. A few factors seem to have contributed to the relative stability of those markets. European institutions apparently reduced their demand for funds in recent quarters by selling dollar-denominated assets and exiting from business lines requiring heavy dollar funding. In addition, European banks reportedly switched to secured funding supported by various types of collateral. Further, the availability of funds from the ECB through its longer-term refinancing operations likely helped reduce funding strains and the need to access interbank markets more generally. Reflecting these developments, the amount of dollar swaps outstanding between the Federal Reserve and the ECB has declined substantially from its peak earlier this year.
Conditions in the CP market were also fairly stable. On net, 30-day spreads of rates on unsecured A2/P2 CP over comparable-maturity AA-rated nonfinancial CP declined a bit. The volume outstanding of unsecured financial CP issued in the United States by institutions with European parents decreased slightly in the first half of the year. The average maturity of unsecured financial CP issued by institutions with both U.S. and European parents is about 50 days, a level that is near the middle of its historical range (figure 41).
Signs of stress were also largely absent in secured short-term dollar funding markets. In the market for repurchase agreements, bid-asked spreads for most collateral types were little changed. However, short-term interest rates continued to edge up from the level observed around the turn of the year, likely reflecting in part the financing of the increase in dealers' inventories of shorter-term Treasury securities that resulted from the ongoing MEP and higher-than-expected bill issuance by the Treasury Department earlier in the year. In asset-backed commercial paper (ABCP) markets, volumes outstanding declined for programs with European sponsors, and spreads on ABCP with European bank sponsors remained a bit above those on ABCP with U.S. bank sponsors.
Respondents to the Senior Credit Officer Opinion Survey on Dealer Financing Terms (SCOOS) in both March and June indicated that credit terms applicable to important classes of counterparties have been relatively stable since the beginning of the year.7 In addition, dealers reported that the use of financial leverage among hedge funds had decreased somewhat since the beginning of 2012. Moreover, respondents to the June SCOOS noted an increase in the amount of resources and attention devoted to the management of concentrated exposures to dealers and other financial intermediaries as well as central counterparties and other financial utilities (figure 42). In response to a special question in the June SCOOS, dealers reported that despite the persistently low level of interest rates, only moderate fractions of their unlevered institutional clients had shown an increased appetite for credit risk or duration risk over the past year.
Financial Institutions
Market sentiment toward the banking industry fluctuated in the first half of 2012. Early in the year, after the actions of the European authorities to ease the euro-area crisis and the release of the results from the CCAR, equity prices for bank holding companies (BHCs) increased and their CDS spreads declined. In late spring--as investors reacted to concerns about Europe--equity prices reversed some of those gains, and CDS spreads rose for large BHCs, especially those with substantial investment-banking operations. More recently, Moody's downgraded the long- and short-term credit ratings of five of the six largest U.S. banks, but none of the banks lost their investment-grade status on long-term debt. The short-term debt ratings of some banks were downgraded to Prime-2, which may affect the ability of some to place significant amounts of CP with money market funds, but the market effect appears to have been muted so far, as those banks currently have limited demand for such funding. On balance, equity prices of banks rose significantly from relatively low levels at the start of the year (figure 43); an index of CDS spreads for large BHCs declined about 60 basis points but remained at a high level (figure 44).
The profitability of BHCs decreased slightly in the first quarter of 2012 and remained well below the levels that prevailed before the financial crisis (figure 45). Litigation provisions taken by some large banks in connection with the mortgage settlement reached earlier this year accounted for some of the downward pressure on bank profitability. The variability in earnings due to accounting gains and losses related to changes in the market value of banks' own debt amplified recent swings of bank profits.8 Smoothing through these special factors, profitability has been about flat in recent quarters. Net income continued to be supported by the release of loan loss reserves, albeit to a lesser extent than in the previous year, as charge-off rates decreased a bit further across most major asset classes. Still-subdued dividend payouts and share repurchases as well as reductions in risk-weighted assets pushed regulatory capital ratios higher in the first quarter of 2012 (see the box "Implementing the New Financial Regulatory Regime").
Implementing the New Financial Regulatory Regime
The Board of Governors is involved in approximately 250 initiatives--including rulemakings, associated guidance, studies of various financial issues, and design of internal processes--related to the Dodd-Frank Wall Street Reform and Consumer Protection Act of 2010 (Dodd-Frank Act). The Board is the lead agency responsible for implementing a significant number of rulemakings required under the act and is also, on many of these initiatives, working in conjunction with other federal agencies. For example, as a member of the Financial Stability Oversight Council (FSOC), the Board has contributed to FSOC studies mandated by the act and has assisted the FSOC with proposed and final rulemakings.
A number of the rulemakings are directed at enhancing bank supervision and prudential standards. In one recent action, the Board and the other federal bank regulatory agencies issued a final rule on June 7, 2012, that implements changes to the market risk capital rule. These changes bring it into conformance with international standards and replace agency credit ratings with alternative standards of creditworthiness in accordance with the requirements of section 939A of the Dodd-Frank Act.1 In addition, "living wills" were prepared by bank holding companies with assets of $50 billion or more based on a final rule issued in October 2011.2 On June 29, 2012, the Board and the Federal Deposit Insurance Corporation announced the process they will use to review, during the second half of 2012, the first set of these plans from some of the largest internationally active banking organizations.3
Also, several key notices of proposed rulemakings (NPRs) implementing the Dodd-Frank Act have been issued thus far in 2012. In particular, on June 7, 2012, the Board issued for comment three proposed rules that, taken together, integrate the capital provisions of section 171 of the act with those of Basel III capital standards in order to enhance financial stability while minimizing the burden on affected institutions.4
The first NPR would increase the quantity and quality of capital by, in part, requiring a new minimum common equity Tier 1 ratio of 4.5 percent, instituting a common equity Tier 1 capital conservation buffer of 2.5 percent, and raising the minimum for the broader Tier 1 capital ratio from 4 percent to 6 percent.5 The NPR does not address specific Basel III liquidity standards, which have not been finalized by the Basel Committee on Banking Supervision.6
The second NPR revises certain aspects of the risk-based capital requirements in order to enhance risk sensitivity and address weaknesses in the calculation of risk-weighted assets that have been identified over the past several years. The third NPR requires internationally active banks to improve the risk sensitivity of parts of their current advanced approaches to risk-based capital processes to better address counterparty credit risk and interconnectedness among financial institutions.
Several other actions taken with regard to the Dodd-Frank Act provided additional clarity to proposed rulemakings. For example, on April 2, 2012, the Board published an amendment to a proposed rulemaking clarifying the activities that are deemed to be financial for purposes of title I of the Dodd-Frank Act. This rulemaking is designed to provide clarity regarding firms that may be designated for enhanced supervision by the FSOC.7 In addition, the Board, along with other regulatory agencies, is reviewing about 19,000 comment letters on the proposal to implement section 619 of the act, commonly known as the Volcker rule. The rule generally prohibits banking entities from engaging in proprietary trading or acquiring an ownership interest in, sponsoring, or having certain other relationships with a hedge fund or private equity fund. On April 19, the Board issued a clarification regarding the Volcker rule conformance period, stating that a banking entity has the full two-year period provided by statute (that is, until July 21, 2014), unless extended by the Board, to fully conform its activities and investments to the requirements of the Volcker rule.8
Footnotes
1. Board of Governors of the Federal Reserve System (2012), "Federal Reserve Board Approves Final Rule to Implement Changes to Market Risk Capital Rule," press release, June 7, www.federalreserve.gov/newsevents/press/bcreg/20120607b.htm.
2. Board of Governors of the Federal Reserve System (2011), "Federal Reserve Board Approves Final Rule Implementing the Resolution Plan Requirement of the Dodd-Frank Act," press release, October 17, www.federalreserve.gov/newsevents/press/bcreg/20111017a.htm.
3. Board of Governors of the Federal Reserve System and Federal Deposit Insurance Corporation (2012), "Federal Reserve Board and Federal Deposit Insurance Corporation Announce Process for Receiving and Evaluating Initial Resolution Plans, Also Known as Living Wills," joint press release, June 29, www.federalreserve.gov/newsevents/press/bcreg/20120629b.htm.
4. With the encouragement and support of the U.S. bank regulatory agencies, the Basel Committee on Banking Supervision has strengthened global capital requirements: raising risk weightings for traded assets, improving the quality of loss-absorbing capital through a new minimum common equity ratio standard, creating a capital conservation buffer, and introducing an international leverage ratio requirement. See Basel Committee on Banking Supervision (2010), Basel III: A Global Regulatory Framework for More Resilient Banks and Banking Systems (Basel, Switzerland: Bank for International Settlements, December; rev. June 2011), www.bis.org/publ/bcbs189.htm .
5. The Tier 1 capital ratio is the ratio of Tier 1 capital to risk-weighted assets. Tier 1 capital consists primarily of common equity (excluding intangible assets such as goodwill and excluding net unrealized gains on investment account securities classified as available for sale) and certain perpetual preferred stock.
6.Basel Committee on Banking Supervision (2010), Basel III: International Framework for Liquidity Risk Measurement, Standards and Monitoring (Basel, Switzerland: Bank for International Settlements, December), www.bis.org/publ/bcbs188.htm .
7. Under title I of the Dodd-Frank Act, a company generally can be designated for Board supervision by the FSOC only if 85 percent or more of the company's revenues or assets are related to activities that are financial in nature under the Bank Holding Company Act.
8. Board of Governors of the Federal Reserve System, Commodity Futures Trading Commission, Federal Deposit Insurance Corporation, Office of the Comptroller of the Currency, and Securities and Exchange Commission (2012), "Volcker Rule Conformance Period Clarified," joint press release, April 19, www.federalreserve.gov/newsevents/press/bcreg/20120419a.htm.
Credit provided by commercial banking organizations in the United States increased in the first half of 2012 at about the same moderate pace as in the second half of 2011. Core loans--the sum of C&I loans, real estate loans, and consumer loans--expanded modestly; as noted earlier, the upturn in lending was particularly noticeable for C&I loans (figure 46). The expansion in C&I lending has been broad based outside of U.S. branches and agencies of European banks and has been particularly evident at large domestic banks. This pattern is consistent with SLOOS results suggesting that a portion of the increase in C&I lending observed at large domestic banks reflected decreased competition from European banks and their affiliates and subsidiaries for either foreign or domestic customers. Banks' holdings of securities rose moderately, with purchases concentrated in Treasury securities and agency-guaranteed MBS. Given the still-depressed housing market, banks continued to be attracted by the government guarantee on agency securities, and some large banks may also have been accumulating government-backed securities to improve their liquidity positions.
Corporate Debt and Equity Markets
Yields on investment-grade bonds reached record lows in June, partly reflecting the search by investors for relatively safe assets in light of rising concerns about Europe as well as the weakness in the domestic and global economic data releases. However, yields on speculative-grade corporate debt, which had reached record-low levels in February, rose somewhat in the second quarter reflecting those same concerns. The spread on investment-grade corporate bonds was about unchanged, on net, relative to the start of the year. Despite the backup in yields over the second quarter, spreads on speculative-grade corporate bonds decreased some, on balance, over the same period (figure 47). Prices in the secondary market for syndicated leveraged loans have changed little, on balance, since the beginning of the year; demand from institutional investors for these mostly floating-rate loans has remained strong despite the reemergence of anxiety about developments in Europe (figure 48).
Broad equity price indexes were boosted early in the year by improved sentiment stemming in part from relatively strong job gains as well as actions taken by major central banks to mitigate the financial strains emanating from Europe. However, equity price indexes subsequently reversed a portion of their earlier gains as concerns about the European banking and fiscal crisis intensified again and economic reports suggested slower growth, on balance, at home and abroad (figure 49). The spread between the 12-month forward earnings-price ratio for the S&P 500 and a real long-run Treasury yield--a rough gauge of the equity risk premium--widened a bit more in the first half of 2012, and is now closer to the very high levels it reached in 2008 and again last fall (figure 50). Implied volatility for the S&P 500 index, as calculated from option prices, spiked at times this year but is currently toward the bottom end of the range that this indicator has occupied since the onset of the financial crisis (figure 51).
In the current environment of very low interest rates, mutual funds that invest in higher-yielding debt instruments (including speculative-grade corporate bonds and leveraged loans) continued to have significant inflows for most of the first half of 2012, while money market funds experienced outflows (figure 52). Equity mutual funds also recorded modest outflows early in the year and, as market sentiment deteriorated, both equity and high-yield mutual funds registered outflows in May.
Monetary Aggregates and the Federal Reserve's Balance Sheet
The growth rate of M2 slowed in the first half of 2012 to an annual rate of about 7 percent (figure 53).9 However, the levels of M2 and its largest component, liquid deposits, remain elevated relative to what would have been expected based on historical relationships with nominal income and interest rates, likely reflecting investors' continued preference to hold safe and liquid assets. Currency in circulation increased robustly, reflecting solid demand both at home and abroad. Retail money market funds and small time deposits continued to contract. At the same time as currency in circulation was increasing, reserve balances held at the Federal Reserve were decreasing; as a result, the monetary base--which is equal to the sum of these two items--changed little, on average, over the first half of the year.
Total assets of the Federal Reserve decreased to $2,868 billion as of July 11, 2012, about $60 billion less than at the end of 2011 (table 1). The small decrease since December largely reflects lower usage of foreign central bank liquidity swaps and declines in the net portfolio holdings of the Maiden Lane LLCs. The composition of Treasury security holdings changed over the course of the first half of this year as a result of the implementation of the MEP. As of July 13, 2012, the Open Market Desk at the Federal Reserve Bank of New York (FRBNY) had purchased $283 billion in Treasury securities with remaining maturities of 6 to 30 years and sold or redeemed $293 billion in Treasury securities with maturities of 3 years or less under the MEP.10 Total Federal Reserve holdings of agency MBS increased about $18 billion as the policy of reinvesting principal payments from agency debt and agency MBS into agency MBS continued.
1. Selected components of the Federal Reserve balance sheet, 2010-12 Millions of dollars
Note: LLC is a limited liability company.
1. The Federal Reserve has extended credit to several LLCs in conjunction with efforts to support critical institutions. Maiden Lane LLC was formed to acquire certain assets of The Bear Stearns Companies, Inc. Maiden Lane II LLC was formed to purchase residential mortgage-backed securities from the U.S. securities lending reinvestment portfolio of subsidiaries of American International Group, Inc. (AIG). Maiden Lane III LLC was formed to purchase multisector collateralized debt obligations on which the Financial Products group of AIG has written credit default swap contracts.
2. Includes only MBS purchases that have already settled.
. . . Not applicable.
Source: Federal Reserve Board, Statistical Release H.4.1, "Factors Affecting Reserve Balances of Depository Institutions and Condition Statement of Federal Reserve Banks."
In the first half of 2012, the Federal Reserve continued to reduce its exposure to facilities established during the financial crisis to support specific institutions. The portfolio holdings of Maiden Lane LLC, Maiden Lane II LLC, and Maiden Lane III LLC--entities that were created during the crisis to acquire certain assets from The Bear Stearns Companies, Inc., and American International Group, Inc. (AIG), to avoid the disorderly failures of those institutions--declined, on net, primarily as a result of asset sales and principal payments. Of note, proceeds from the sales of all of the remaining assets in the Maiden Lane II LLC portfolio in January and February enabled the repayment of the entire remaining outstanding balance of the senior loan from the FRBNY to Maiden Lane II LLC in March, with interest and a $2.8 billion net gain. In addition, proceeds from the sales of assets from Maiden Lane LLC and Maiden Lane III LLC in April and May enabled the repayment, with interest, of the entire remaining outstanding balances of the senior loans from the FRBNY to Maiden Lane LLC and Maiden Lane III LLC in June. Proceeds from further asset sales from Maiden Lane III in June enabled repayment of the equity position of AIG in July. A net gain on the sale of the remaining assets in Maiden Lane III LLC is likely during the next few months. Sales of most of the remaining assets in Maiden Lane LLC should be completed by the end of the year, but a few legacy assets may take longer to dispose of. Loans outstanding under the Term Asset-Backed Securities Loan Facility (TALF) were slightly lower, reflecting, in part, the first maturity of a TALF loan with a three-year initial term.
On the liability side of the Federal Reserve's balance sheet, deposits held by depository institutions declined about $42 billion in the first half of 2012, while Federal Reserve notes in circulation increased roughly $39 billion. As part of its ongoing program to ensure the readiness of tools to drain reserves when doing so becomes appropriate, the Federal Reserve conducted a series of small-scale reverse repurchase transactions involving all eligible collateral types with its expanded list of counterparties. In the same vein, the Federal Reserve also continued to offer small-value term deposits through the Term Deposit Facility.
On March 20, the Federal Reserve System released its 2011 combined annual comparative audited financial statements. The Federal Reserve reported net income of about $77 billion for the year ending December 31, 2011, derived primarily from interest income on securities acquired through open market operations (Treasury securities, federal agency and GSE MBS, and GSE debt securities). The Reserve Banks transferred about $75 billion of the $77 billion in comprehensive income to the U.S. Treasury in 2011; though down slightly from 2011, the transfer to the U.S. Treasury remained historically very large.
International Developments
International Developments
An Update on the European Fiscal and Banking Crisis
Over the past several months, the crisis in Europe has waxed and waned as stresses related to financing sovereigns and the condition of banking sectors have forced significant, but not definitive, policy responses. Late last year, the ongoing difficulties in the region, combined with deteriorating economic conditions, led to acute funding pressures for European financial institutions and a number of sovereigns. In response, the European Central Bank took actions in early December to ease credit conditions, including the provision of three-year refinancing to banks, and euro-area leaders agreed to strengthen fiscal rules and expand their rescue facilities. Those actions, along with the re-pricing and duration extension of the dollar liquidity swap lines with the Federal Reserve, reduced funding costs in euros and dollars for European banks and contributed to a marked improvement in financial conditions in the first few months of this year.
Early in 2012, euro-area authorities followed through on their commitment to put Greek finances on a more sustainable footing and to review the adequacy of the financial backstops for other vulnerable European countries. The Greek government concluded a restructuring of its privately held bonds, which reduced the face value of that debt by slightly more than half, and negotiated a second program with the European Union (EU) and the International Monetary Fund (IMF) worth about €170 billion. Around the same time, euro-area authorities lifted the ceiling on the combined lending of the region's rescue facilities, the European Financial Stability Facility and its successor, the European Stability Mechanism (ESM), from €500 billion to €700 billion, and they accelerated the schedule for capitalizing the ESM. In addition, leaders of the Group of Twenty countries and other IMF shareholders pledged about $450 billion in new financing to the IMF, which should enable the IMF to substantially increase its lending capacity.
Notwithstanding these initiatives, events in Greece and Spain during the spring again heightened financial stresses throughout the region. Political uncertainty in Greece increased considerably, and market concerns grew over the possibility of a Greek exit from the euro area, after the country's inconclusive parliamentary elections in early May. Amid increasing political fragmentation and strong electoral support for parties calling for a major renegotiation of the second EU-IMF program, elected representatives were unable to form a majority government and another round of elections was held on June 17. In the weeks leading up to the second election, withdrawals of deposits from Greek banks reportedly increased, adding to pressures on the domestic financial system. Ultimately, the two major parties that had negotiated the second EU-IMF program obtained sufficient votes to form the core of a coalition government. Uncertainty remains, however, over possible renegotiation of the terms of the EU-IMF program for Greece. Regardless of the outcome of those discussions, the Greek government must still implement difficult austerity measures to continue receiving official financing under the program.
Financial stresses also increased sharply in Spain as concerns about its public finances and the cost of stabilizing the banking system mounted. With economic activity declining, unemployment on the rise, and the budgets of regional governments under considerable strains, the Spanish government missed its 2011 budget deficit target by a wide margin and raised the country's deficit target for 2012 after contentious negotiations with euro-area authorities. Meanwhile, the ongoing bust in the Spanish real estate sector and the depressed economic conditions more generally continued to weigh on the profitability of regional and local banks, prompting market speculation that the public debt could be significantly boosted by further bank bailouts. As market pressures increased, in June the Spanish government requested European financial assistance of up to €100 billion for its banking system. Markets remained concerned, however, in part because the assistance would have the effect of increasing Spain's sovereign debt.
As pressures on Spain mounted and spilled over to Italy, there were renewed calls for euro-area countries to move toward greater fiscal and financial union. At their June 28-29 summit, EU officials announced additional measures toward that goal. Leaders pledged to further integrate the supervision of European banks, to allow the euro-area financial backstop facilities to directly recapitalize banks (as opposed to requiring sovereigns to borrow to support their banks), and to provide greater lending through the European Investment Bank in support of growth and employment. Essential details about implementation of such initiatives, however, have yet to be resolved.
All told, European economies still face significant challenges. In the near term, euro-area policymakers must restore confidence in the region's banks and in the sustainability of sovereign finances. Policy measures, including the steps to improve the availability of dollar and euro funds late last year, are supporting access to funding for European banks, but risks to the stability of domestic financial systems remain. The region must also find ways to stimulate economic growth and improve competitiveness in the most vulnerable countries even as they undertake major fiscal consolidations. Over the longer term, euro-area policymakers need to establish an effective institutional framework to foster economic, financial, and fiscal integration and, ultimately, to increase the resilience of the monetary union.
International Financial Markets
Foreign financial markets have been volatile. Initially in the first quarter, encouraging macroeconomic data and some easing of tensions within the euro area led to an improvement in global financial conditions. This improvement was reversed in the spring as the boost from previous policy measures, including the ECB's longer-term refinancing operations, faded and political and banking stresses in vulnerable European countries resurfaced. Euro-area leaders responded to the worsening of the crisis by announcing additional measures at a summit on June 28-29. The market reaction was positive but short-lived.
Increased uncertainty and greater volatility have pushed up the foreign exchange value of the dollar about 4-1/4 percent on a trade-weighted basis against a broad set of currencies since its low in early February, with most of the appreciation occurring in May (figure 54). Typical of periods of flight to safety, the dollar has appreciated against most currencies but depreciated against the Japanese yen for most of the period (figure 55). The Swiss franc has moved very closely with the euro as the Swiss National Bank has intervened to maintain a ceiling for the franc relative to the euro.
Figure 54. U.S. Dollar Nominal Exchange Rate, Broad Index, 2007-12
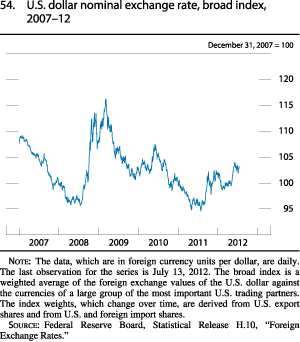
The data, which are in foreign currency units per dollar, are daily. The last observation for the series is July 13, 2012. The broad index is a weighted average of the foreign exchange values of the U.S. dollar against the currencies of a large group of the most important U.S. trading partners. The index weights, which change over time, are derived from U.S. export shares and from U.S. and foreign import shares.
Source: Federal Reserve Board, Statistical Release H.10, "Foreign Exchange Rates."
Figure 55. U.S. Dollar Exchange Rate against Selected Major Currencies, 2010-12
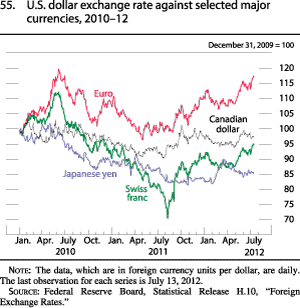
The data, which are in foreign currency units per dollar, are daily. The last observation for each series is July 13, 2012.
Source: Federal Reserve Board, Statistical Release H.10, "Foreign Exchange Rates."
During the second quarter of this year, flight-to-safety flows and the deteriorating global economic outlook helped push government bond yields for Canada, Germany, and the United Kingdom to record lows (figure 56). Likewise, Japanese yields on 10-year bonds fell well below 1 percent. By contrast, Spanish sovereign spreads over German bunds rose more than 250 basis points between February and June due to escalating concerns over Spain's public finances (figure 57). Italian sovereign spreads moved up as well over this period.
Figure 56. Yields on Benchmark Government Bonds in Selected Advanced Foreign Economies, 2009-12
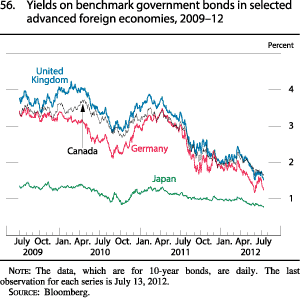
The data, which are for 10-year bonds, are daily. The last observation for each series is July 13, 2012.
Source: Bloomberg.
Figure 57. Government Debt Spreads for Peripheral European Economies, 2009-12
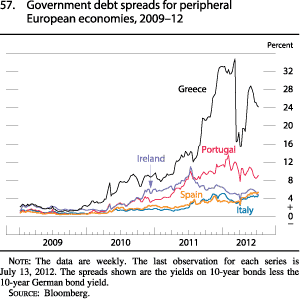
The data are weekly. The last observation for each series is July 13, 2012. The spreads shown are the yields on 10-year bonds less the 10-year German bond yield.
Source: Bloomberg.
Equity prices abroad declined significantly in the second quarter, more so than in the United States. Indexes tumbled in the nations at the center of the euro-area fiscal and banking crisis, and the fall in value from their March peaks was more than 10 percent across the advanced foreign economies (AFEs) (figure 58). This fall was attenuated toward the end of the second quarter by the positive market reaction to the June summit. Equity markets in the EMEs were also markedly down in the second quarter (figure 59).
Figure 58. Equity Indexes in Selected Advanced Foreign Economies, 2009-12
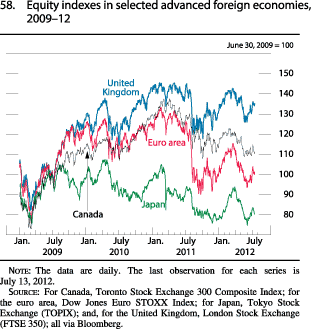
The data are daily. The last observation for each series is July 13, 2012.
Source: For Canada, Toronto Stock Exchange 300 Composite Index; for the euro area, Dow Jones Euro STOXX Index; for Japan, Tokyo Stock Exchange (TOPIX); and, for the United Kingdom, London Stock Exchange (FTSE 350); all via Bloomberg.
Figure 59. Aggregate Equity Indexes for Emerging Market Economies, 2009-12
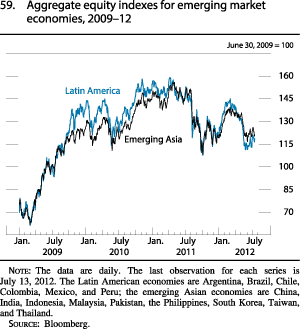
The data are daily. The last observation for each series is July 13, 2012. The Latin American economies are Argentina, Brazil, Chile, Colombia, Mexico, and Peru; the emerging Asian economies are China, India, Indonesia, Malaysia, Pakistan, the Philippines, South Korea, Taiwan, and Thailand.
Source: Bloomberg.
European banks faced renewed stresses in recent months. In Greece, after inconclusive elections in early May, deposit outflows from banks accelerated, generating concerns that deposit flight could spread to banking systems in the rest of the euro area. News that Spain had partly nationalized the troubled lender Bankia and would need to inject an additional €19 billion into the bank and its holding company added to unease about the region, eventually leading to plans for an official aid package of up to €100 billion to recapitalize Spanish banks. Apprehension about bank health was widespread, with major institutions in Italy, Germany, and several other European countries receiving credit ratings downgrades. As a result, European bank stock prices have tumbled since mid-March (figure 60). At the same time, reflecting market views of increased risk of default, the CDS premiums on the debt of many large banks in Europe have risen substantially (figure 61), while issuance of unsecured bank debt, which had previously recovered, has fallen. Notwithstanding these developments, funding market stresses have remained relatively muted, as many banks accessed funds from the Eurosystem--the system formed by the ECB and the national central banks of the euro-area member states--rather than interbank markets. A standard measure of the cost of this interbank funding, the implied basis spread from euro-dollar swaps, was little changed at shorter maturities.
Figure 60. Bank Stock Price Indexes for Selected European Countries, 2011-12
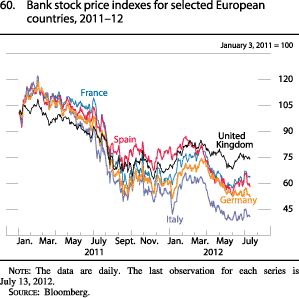
The data are daily. The last observation for each series is July 13, 2012.
Source: Bloomberg.
Figure 61. Credit Default Swap Premiums for Banks in Selected European Countries, 2011-12
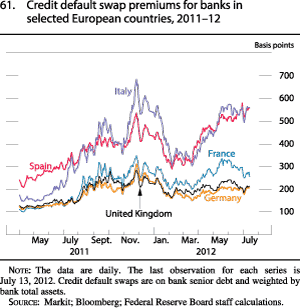
The data are daily. The last observation for each series is July 13, 2012. Credit default swaps are on bank senior debt and weighted by bank total assets.
Source: Markit; Bloomberg; Federal Reserve Board staff calculations.
Advanced Foreign Economies
The European fiscal and banking crisis was at the center of economic developments in the AFEs. Euro-area real GDP was flat in the first quarter of 2012 following a contraction in late 2011. Within the euro area, output fell sharply in more vulnerable countries, including Italy and Spain, whereas other countries, especially Germany, performed better. Mounting financial tensions and fiscal austerity measures appear to have further restrained the euro-area economy in the second quarter, as evidenced by declining business confidence and a further drift of purchasing managers indexes into contractionary territory.
Economic performance in the other AFEs has been uneven. In the United Kingdom, real GDP continued to fall early in the year, and indicators point to further weakness fueled by tight fiscal policy and negative spillover effects from the euro area. In Japan, output rose at a robust pace in the first quarter, reflecting fiscal stimulus measures as well as a recovery from the shortage of parts supplies caused by the floods in Thailand last year, but recent data suggest that activity decelerated in the second quarter. The Canadian economy continued to expand moderately in the first three months of the year, supported by solid domestic demand and a resilient labor market.
In most AFEs, headline inflation rates--measured on a 12-month change basis--continued to decline in the first half of the year as the effects of the large run-up in commodity prices in early 2011 waned. The smaller run-up in energy prices that took place early this year exerted a less marked effect on consumer prices, though it helped keep 12-month inflation rates above 2 percent in the euro area and in the United Kingdom (figure 62). Japan appears to be emerging from several years of deflation, but Japanese inflation remains below the 1 percent inflation goal introduced by the BOJ in February.
Several central banks eased further their monetary policy stances. The BOJ increased the size of its asset purchases from ¥30 trillion to ¥40 trillion in April, and then to ¥45 trillion in July. The ECB, after having conducted the second of its three-year longer-term refinancing operations in late February, cut its policy interest rates to record lows in early July (figure 63). In late June, the Bank of England (BOE) activated its Extended Collateral Term Repo facility, offering six-month funds against a wide set of collateral. In addition, in July, the BOE increased the size of its asset purchase program from £325 billion to £375 billion, and, together with the U.K. Treasury, introduced a new Funding for Lending Scheme designed to boost lending to households and firms.
Figure 62. Change in Consumer Prices for Major Foreign Economies, 2008-12
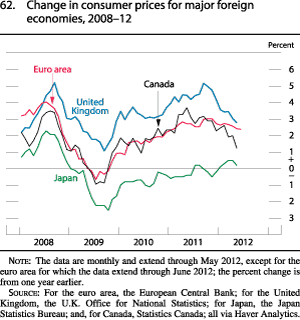
The data are monthly and extend through May 2012, except for the euro area for which the data extend through June 2012; the percent change is from one year earlier.
Source: For the euro area, the European Central Bank; for the United Kingdom, the U.K. Office for National Statistics; for Japan, the Japan Statistics Bureau; and, for Canada, Statistics Canada; all via Haver Analytics.
Figure 63. Official or Targeted Interest Rates in Selected Advanced Foreign Economies, 2008-12
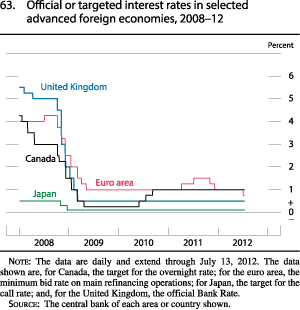
The data are daily and extend through July 13, 2012. The data shown are, for Canada, the target for the overnight rate; for the euro area, the minimum bid rate on main refinancing operations; for Japan, the target for the call rate; and, for the United Kingdom, the official Bank Rate.
Source: The central bank of each area or country shown.
Emerging Market Economies
Following a disappointing performance at the end of last year, real GDP growth rebounded in the first quarter in most EMEs. Economic activity expanded especially briskly in emerging Asia, largely reflecting the reconnection of supply chains damaged by the floods in Thailand. Economic growth, however, continued to slow in China and India. Moreover, recent indicators suggest that the pace of economic activity decelerated in most EMEs going into the second quarter amid headwinds associated with the European crisis and relatively subdued growth in China.
In China, real GDP increased at about a 7 percent pace in the first half of the year, down from an 8-1/2 percent pace in the second half of last year. The slowdown reflected weaker demand for Chinese exports as well as domestic factors, including moderating consumer spending and the restraining effects on investment of previous government measures to cool activity in the property sector. Macroeconomic data for May and June suggest that economic activity was picking up a bit toward the end of the second quarter, with growth of investment, retail sales, and bank lending edging higher. Headline 12-month inflation fell to 2.2 percent in June, led by additional moderation in food prices. As inflationary pressures eased and concerns about growth mounted, the People's Bank of China lowered banks' reserve requirements by 50 basis points in both February and May and then reduced the benchmark one-year lending rate by 25 basis points in June and 31 basis points in July, the first changes in that rate since an increase in July of last year. Over the first half of the year, the renminbi was little changed, on net, against the dollar, but it appreciated about 1-1/2 percent on a real trade-weighted basis, as the renminbi followed the dollar upward against China's other major trading partners.
In India, economic growth has also moderated as slow progress on fiscal and structural reforms and previous monetary tightening stalled investment. Noting rising vulnerabilities from the country's twin fiscal and current account deficits, some credit rating agencies warned that India's sovereign debt risks losing its investment-grade status.
In Mexico, economic activity rebounded briskly in the first quarter as the agricultural sector rebounded from the fourth-quarter drought, domestic demand gained momentum, and exports to the United States picked up. Economic indicators, however, suggest that growth moderated somewhat in the second quarter. On July 1, Enrique Peña Nieto of the Institutional Revolutionary Party, or PRI, won the Mexican presidential election, promising to pursue market-oriented reforms to bolster economic growth.
In Brazil, real GDP--restrained by flagging investment and weather-related problems in the agricultural sector--increased slightly in the first quarter, making it the fourth consecutive quarter of below-trend growth. Industrial production, which has been on a downward trend since early 2011, continued to fall through May, suggesting that economic activity in Brazil remained weak in the second quarter.
Headline inflation generally moderated in the EMEs reflecting lower food price pressures and weaker economic growth. In addition to China, several other central banks in the EMEs also loosened monetary policy, including those in Brazil, Chile, India, Indonesia, the Philippines, South Korea, and Thailand.
Footnotes
1. The SLOOS is available on the Federal Reserve Board's website at www.federalreserve.gov/boarddocs/SnLoanSurvey.
2. The act includes some provisions that place restrictions on issuers' ability to impose certain fees and to engage in risk-based pricing.
3. The original amount for a C&I loan is defined in the Call Report as the maximum of the amount of the loan or the amount of the total commitment.
4. Indeed, the second largest IPO on record began trading in mid-May. However, the price performance of those shares in the days following that offering was sharply negative on net, and IPO activity subsequently weakened significantly.
5. The subsidy costs of outstanding Troubled Asset Relief Program assistance are reestimated annually by updating cash flows for actual experience and new assumptions about the future performance of the programs; any changes in these estimated subsidy costs are recorded in the federal budget in the current fiscal year.
6. In 1999, the BEA--while revisiting its methodology for the balance of payments accounts--redefined the current account to exclude capital transfers. In the process, the capital account was renamed the financial account, and a newly defined capital account was created to include capital transfers as well as the acquisition and disposal of nonproduced nonfinancial assets.
7. The SCOOS is available on the Federal Reserve Board's website at www.federalreserve.gov/econresdata/releases/scoos.htm.
8. Under fair value accounting rules, changes in the creditworthiness of a BHC generate changes in the value of some of its liabilities. Those changes are then reflected as gains or losses on the income statement.
9. M2 consists of (1) currency outside the U.S. Treasury, Federal Reserve Banks, and the vaults of depository institutions; (2) traveler's checks of nonbank issuers; (3) demand deposits at commercial banks (excluding those amounts held by depository institutions, the U.S. government, and foreign banks and official institutions) less cash items in the process of collection and Federal Reserve float; (4) other checkable deposits (negotiable order of withdrawal, or NOW, accounts and automatic transfer service accounts at depository institutions; credit union share draft accounts; and demand deposits at thrift institutions); (5) savings deposits (including money market deposit accounts); (6) small-denomination time deposits (time deposits issued in amounts of less than $100,000) less individual retirement account (IRA) and Keogh balances at depository institutions; and (7) balances in retail money market mutual funds less IRA and Keogh balances at money market mutual funds.
10. Between the MEP's announcement in September 2011 and the end of that year, the Desk had purchased $133 billion in longer-term Treasury securities and had sold $134 billion in shorter-term Treasury securities.
*On August 30, 2012, the data in Figures 51, 58, 59, and 61 were corrected to extend through July 13, 2012, as originally noted. In addition, in Figure 61, the historical values of some series are slightly different than previously shown, reflecting changes in the set of banks included in the calculations.
Monetary Policy
Monetary Policy over the First Half of 2012
Figure 64. Selected Interest Rates, 2008-12, Target Federal Funds Rate
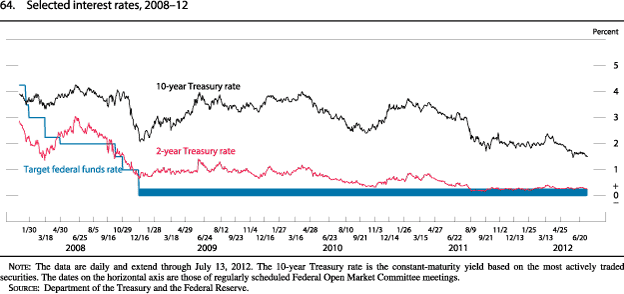
The data are daily and extend through July 13, 2012. The 10-year Treasury rate is the constant-maturity yield based on the most actively traded securities.
Source: Department of the Treasury.
The information reviewed at the January 24-25 meeting indicated that U.S. economic activity had expanded moderately, while global growth appeared to be slowing. Labor market indicators pointed to some further improvement in labor market conditions, but progress was gradual and the unemployment rate remained elevated. Household spending had continued to advance at a moderate pace despite diminished growth in real disposable income, but growth in business fixed investment had slowed. The housing sector remained depressed. Inflation had been subdued in recent months, and longer-term inflation expectations had remained stable. Meeting participants observed that financial conditions had improved and financial market stresses had eased somewhat during the intermeeting period, in part because of the European Central Bank's (ECB) three-year refinancing operation. Nonetheless, participants expected that global financial markets would remain focused on the evolving situation in Europe, and they anticipated that further policy efforts would be required to fully address the fiscal and financial problems there.
With the economy facing continuing headwinds and growth slowing in several U.S. export markets, members generally expected a modest pace of economic growth over coming quarters, with the unemployment rate declining only gradually. At the same time, members thought that inflation would run at levels at or below those consistent with the Committee's dual mandate. Against this backdrop, members agreed to keep the target range for the federal funds rate at 0 to 1/4 percent, to continue the program of extending the average maturity of the Federal Reserve's holdings of securities as announced in September, and to retain the existing policies regarding the reinvestment of principal payments from Federal Reserve holdings of securities. In light of the economic outlook, most members also agreed to indicate that the Committee anticipates that economic conditions are likely to warrant exceptionally low levels for the federal funds rate at least through late 2014, longer than had been indicated in recent FOMC statements. The Committee also stated that it is prepared to adjust the size and composition of its securities holdings as appropriate to promote a stronger economic recovery in a context of price stability.
The data in hand at the March 13 FOMC meeting indicated that U.S. economic activity had continued to expand moderately. Although the unemployment rate remained elevated, it had declined notably in recent months and payroll employment had increased. Household spending and business fixed investment had advanced. Signs of improvement or stabilization emerged in some local housing markets, but overall housing activity continued to be restrained by the substantial inventory of foreclosed and distressed properties, tight credit conditions for mortgage loans, and uncertainty about the economic outlook and future home prices. Inflation continued to be subdued, although prices of crude oil and gasoline had increased substantially. Longer-term inflation expectations had remained stable.
Many participants believed that policy actions in the euro area, notably the Greek debt swap and the ECB's longer-term refinancing operations, had helped ease strains in financial markets and reduced the downside risks to the U.S. and global economic outlook. Against that backdrop, equity prices had risen and conditions in credit markets improved, leading many meeting participants to see financial conditions as more supportive of economic growth than at the time of the January meeting.
Members viewed the information on U.S. economic activity as suggesting that the economy would continue to expand moderately. However, despite the easing of strains in global financial markets, members continued to perceive significant downside risks to economic activity. Members generally anticipated that the recent increase in oil and gasoline prices would push up inflation temporarily, but that inflation subsequently would run at or below the rate that the Committee judges most consistent with its mandate. As a result, the Committee decided to keep the target range for the federal funds rate at 0 to 1/4 percent, to reiterate its anticipation that economic conditions were likely to warrant exceptionally low levels for the federal funds rate at least through late 2014, to continue the program of extending the average maturity of the Federal Reserve's holdings of securities that it had adopted in September, and to maintain the existing policies regarding the reinvestment of principal payments from Federal Reserve holdings of securities. The Committee again stated that it is prepared to adjust the size and composition of its securities holdings as appropriate to promote a stronger economic recovery in a context of price stability.
By the time of the April 24-25 FOMC meeting, the data again indicated that economic activity was expanding moderately. Payroll employment had continued to move up, and the unemployment rate, while still elevated, had declined a little further. Household spending and business fixed investment had continued to expand. The housing sector showed signs of improvement but from a very low level of activity. Mainly reflecting the increase in the prices of crude oil and gasoline earlier this year, inflation had picked up somewhat; however, measures of long-run inflation expectations remained stable. Meeting participants judged that, in general, conditions in domestic credit markets had improved further, but noted that investors' concerns about the sovereign debt and banking situation in the euro area intensified during the intermeeting period. Many U.S. financial institutions had been taking steps to bolster their resilience, including expanding their capital levels and liquidity buffers and reducing their European exposures.
Members expected growth to be moderate over coming quarters and then to pick up over time. Strains in global financial markets stemming from the sovereign debt and banking situation in Europe as well as uncertainty about U.S. fiscal policy continued to pose significant downside risks to economic activity both here and abroad. Most members anticipated that the increase in inflation would prove temporary and that subsequently inflation would run at or below the rate that the Committee judges to be most consistent with its mandate. Against this backdrop, the Committee members reached the collective judgment that it would be appropriate to maintain the existing highly accommodative stance of monetary policy. In particular, the Committee agreed to keep the target range for the federal funds rate at 0 to 1/4 percent, to continue the program of extending the average maturity of the Federal Reserve's holdings of securities as announced last September, and to retain the existing policies regarding the reinvestment of principal payments from Federal Reserve holdings of securities. The Committee left the forward guidance for the target federal funds rate unchanged at this meeting. Members emphasized that their forward guidance was conditional on expected economic developments, but they preferred adjusting the forward guidance only once they were more confident that the medium-term economic outlook or the risks to that outlook had changed significantly.
Data received over the period leading up to the June 19-20 FOMC meeting indicated that economic activity was expanding at a somewhat more modest pace than earlier in the year. Improvements in labor market conditions had slowed in recent months, and the unemployment rate seemed to have flattened out. Household spending appeared to be rising at a somewhat slower rate, and business investment had continued to advance. Despite some ongoing signs of improvement, the housing sector remained depressed. Consumer price inflation had declined, mainly reflecting lower prices of crude oil and gasoline, and longer-term inflation expectations remained well anchored. Meeting participants observed that financial markets were volatile over the intermeeting period and that investor sentiment was strongly influenced by the developments in Europe and evidence of slowing economic growth at home and abroad.
In the discussion of monetary policy, most members agreed that the outlook had deteriorated somewhat relative to the time of the April meeting, and that significant downside risks were present, importantly including the financial stresses in the euro area and uncertainty about the degree of fiscal restraint in the United States, and its effects on economic activity over the medium term. As a result, the Committee decided that providing additional monetary policy accommodation would be appropriate to support a stronger economic recovery and to help ensure that inflation, over time, was at a level consistent with the Committee's dual mandate. Specifically, the Committee agreed to continue the MEP through the end of the year, instead of ending the program in June as had been planned. In doing so, the Federal Reserve will purchase Treasury securities with remaining maturities of 6 years to 30 years and sell or redeem an equal par value of Treasury securities with remaining maturities of approximately 3 years or less. This continuation of the MEP will proceed at about the same pace as had been executed through the first phase of the program, increasing the Federal Reserve's holdings of longer-term Treasury securities by about $267 billion while reducing its holdings of shorter-term Treasury securities by the same amount. For the duration of this program, the Committee directed the Open Market Desk to suspend its current policy of rolling over maturing Treasury securities into new issues at auction (and instead purchase only additional longer-term securities with the proceeds of maturing securities). The Committee expected the continuation of the MEP to put downward pressure on longer-term interest rates and help make broader financial conditions more accommodative. In addition, the Committee decided to continue reinvesting principal payments from its holdings of agency debt and agency MBS in agency MBS. The Committee also decided to keep the target range for the federal funds rate at 0 to 1/4 percent and to reaffirm its anticipation that economic conditions were likely to warrant exceptionally low levels for the federal funds rate at least through late 2014. In its statement, the Committee noted that it was prepared to take further action as appropriate to promote stronger economic recovery and sustained improvement in labor market conditions in a context of price stability.
FOMC Communications
The Committee continued to consider further improvements in its communications approach in the first half of 2012. At the January meeting, the FOMC released a statement of its longer-run goals and policy strategy in an effort to enhance the transparency, accountability, and effectiveness of monetary policy and to facilitate well-informed decisionmaking by households and businesses.13 The statement did not represent a change in the Committee's policy approach, but rather was intended to help enhance the transparency, accountability, and effectiveness of monetary policy. The statement emphasizes the Federal Reserve's firm commitment to pursue its congressional mandate to promote maximum employment, stable prices, and moderate long-term interest rates. To clarify its longer-term objectives, the FOMC stated that inflation at the rate of 2 percent, as measured by the annual change in the price index for personal consumption expenditures, is most consistent over the longer run with the Federal Reserve's statutory mandate. While noting that the Committee's assessments of the maximum level of employment are necessarily uncertain and subject to revision, the statement indicated that the central tendency of FOMC participants' current estimates of the longer-run normal rate of unemployment is between 5.2 and 6.0 percent. It stressed that the Federal Reserve's statutory objectives are generally complementary, but when they are not, the Committee will follow a balanced approach in its efforts to return both inflation and employment to levels consistent with its mandate.
In addition, in light of a decision made at the December meeting, the Committee provided, starting in the January Summary of Economic Projections (SEP), information about each participant's assessment of appropriate monetary policy. Specifically, the SEP included information about participants' estimates of the appropriate level of the target federal funds rate in the fourth quarter of the current year and the next few calendar years, and over the longer run; the SEP also reported participants' current projections of the likely timing of the appropriate first increase in the target federal funds rate given their assessments of the economic outlook. The accompanying narrative described the key factors underlying those assessments and provided some qualitative information regarding participants' expectations for the Federal Reserve's balance sheet.
At the March meeting, participants discussed a range of additional steps that the Committee might take to help the public better understand the linkages between the evolving economic outlook and the Federal Reserve's monetary policy decisions, and thus the conditionality in the Committee's forward guidance. Participants discussed ways in which the Committee might include, in its postmeeting statements and other communications, additional qualitative or quantitative information that could convey a sense of how the Committee might adjust policy in response to changes in the economic outlook. However, participants also observed that the Committee had introduced several important enhancements to its policy communications over the past year or so; these included the Chairman's postmeeting press conference as well as changes to the FOMC statement and the SEP. Against this backdrop, some participants noted that additional experience with the changes implemented to date could be helpful in evaluating potential further enhancements.
At the April meeting, the Committee discussed the relationship between the postmeeting statement, which expresses the collective view of the Committee, and the policy projections of individual participants, which are included in the SEP. The Chairman asked the subcommittee on communications to consider possible enhancements and refinements to the SEP that might help clarify the link between economic developments and the Committee's view of the appropriate stance of monetary policy. Following up on this issue at the June meeting, participants discussed several possibilities for enhancing the clarity and transparency of the Committee's economic projections as well as the role they play in policy decisions and policy communications. Many participants indicated that if it were possible to construct a quantitative economic projection and associated path of appropriate policy that reflected the collective judgment of the Committee, such a projection could potentially be helpful in clarifying how the outlook and policy decisions are related. However, many participants noted that developing a quantitative forecast that reflects the Committee's collective judgment could be challenging, given the range of their views about the economy's structure and dynamics. Participants agreed to continue to explore ways to increase clarity and transparency in the Committee's policy communications, but many emphasized that further changes in those communications should be considered carefully.
Footnotes
11. Members of the FOMC in 2012 consist of the members of the Board of Governors of the Federal Reserve System plus the presidents of the Federal Reserve Banks of Atlanta, Cleveland, New York, Richmond, and San Francisco. As of the June FOMC meeting, Governors Jerome H. Powell and Jeremy C. Stein joined the Board of Governors increasing the number of FOMC members to 12.
12. FOMC statements, minutes, and transcripts, as well as other related information, are available on the Federal Reserve Board's website at www.federalreserve.gov/monetarypolicy/fomc.htm.
13. The FOMC statement of longer-run goals and policy strategy is available on the Federal Reserve Board's website at www.federalreserve.gov/monetarypolicy/fomccalendars.htm.
Summary of Economic Projections
In conjunction with the June 19-20, 2012, Federal Open Market Committee (FOMC) meeting, meeting participants--the 7 members of the Board of Governors and the 12 presidents of the Federal Reserve Banks, all of whom participate in the deliberations of the FOMC--submitted their assessments, under each participant's judgment of appropriate monetary policy, of real output growth, the unemployment rate, inflation, and the target federal funds rate for each year from 2012 through 2014 and over the longer run. These assessments were based on information available at the time of the meeting and participants' individual assumptions about the factors likely to affect economic outcomes. The longer-run projections represent each participant's judgment of the rate to which each variable would be expected to converge, over time, under appropriate monetary policy and in the absence of further shocks to the economy. "Appropriate monetary policy" is defined as the future path of policy that participants deem most likely to foster outcomes for economic activity and inflation that best satisfy their individual interpretations of the Federal Reserve's objectives of maximum employment and stable prices.
Overall, the assessments that FOMC participants submitted in June indicated that, under appropriate monetary policy, the pace of economic expansion over the 2012-14 period would likely continue to be moderate and inflation would remain subdued (see table 1 and figure 1). Participants judged that the growth rate of real gross domestic product (GDP) would pick up gradually and that the unemployment rate would edge down very slowly. Participants projected that inflation, as measured by the annual change in the price index for personal consumption expenditures (PCE), would run close to or below the FOMC's longer-run inflation objective of 2 percent.
Table 1. Economic projections of Federal Reserve Board members and Federal Reserve Bank presidents, June 2012 Percent
1. The central tendency excludes the three highest and three lowest projections for each variable in each year. Return to table
2. The range for a variable in a given year consists of all participants' projections, from lowest to highest, for that variable in that year. Return to table
3. Longer-run projections for core PCE inflation are not collected. Return to table
As shown in figure 2, most participants judged that highly accommodative monetary policy was likely to be warranted over the forecast period. In particular, 13 participants thought that it would be appropriate for the first increase in the target federal funds rate to occur during 2014 or later. A majority of participants judged that appropriate monetary policy would involve an extension of the maturity extension program (MEP) through the end of 2012.
Overall, participants judged the uncertainty associated with the outlook for real activity and the unemployment rate to be unusually high relative to historical norms, with the risks weighted mainly toward slower economic growth and a higher unemployment rate. Many participants also viewed the uncertainty surrounding their projections for inflation to be greater than normal, but most saw the risks to inflation to be broadly balanced.
Figure 1. Central tendencies and ranges of economic projections, 2012�14 and over the longer run*
*NOTE: Definitions of variables are in the notes to table 1. The data for the actual values of the variables are annual.
Accessible version of figure 1 | Return to figure 1
The Outlook for Economic Activity
Consistent with the downward revisions to their projections for real GDP growth in 2012 and 2013, nearly all participants marked up their assessments for the rate of unemployment. Participants projected the unemployment rate at the end of 2012 to remain at or slightly below recent levels, with a central tendency of 8.0 to 8.2 percent, somewhat higher than their April submissions. Participants anticipated gradual improvement in labor market conditions by 2014, but even so, they generally thought that the unemployment rate at the end of that year would still lie well above their individual estimates of its longer-run normal level. The central tendencies of participants' forecasts for the unemployment rate were 7.5 to 8.0 percent at the end of 2013 and 7.0 to 7.7 percent at the end of 2014. The central tendency of participants' estimates of the longer-run normal rate of unemployment that would prevail under the assumption of appropriate monetary policy and in the absence of further shocks to the economy was 5.2 to 6.0 percent, unchanged from April. Most participants projected that the gap between the current unemployment rate and their estimates of its longer-run normal rate would be closed in five or six years, a couple judged that less time would be needed, and one thought more time would be necessary because of the persistent headwinds impeding the economic expansion.
Figures 3.A and 3.B provide details on the diversity of participants' views regarding the likely outcomes for real GDP growth and the unemployment rate over the next three years and over the longer run. The dispersion in these projections reflects differences in participants' assessments of many factors, including appropriate monetary policy and its effects on the economy, the underlying momentum in economic activity, the spill-over effects of the fiscal and financial situation in Europe, the prospective path for U.S. fiscal policy, the extent of structural dislocations in the labor market, and the likely evolution of credit and financial market conditions. Compared with their April assessments, the range of participants' forecasts for the change in real GDP in 2012 and 2013 shifted lower, while the dispersion of individual forecasts for growth in 2014 was about unchanged. Consistent with the downward shift in the distribution of forecasts for economic growth, the distribution of projections for the unemployment rate shifted up in 2012 and 2013 and, to a lesser extent, in 2014. As in April, the dispersion of estimates for the longer-run rate of output growth was fairly narrow, generally in a range of 2.2 to 2.7 percent. In contrast, participants' views about the level to which the unemployment rate would converge in the longer run were more diverse, reflecting, among other things, different views on the outlook for labor supply and the structure of the labor market.
Figure 2. Overview of FOMC participants� assessments of appropriate monetary policy, June 2012*
*NOTE: In the upper panel, the height of each bar denotes the number of FOMC participants who judge that, under appropriate monetary policy, the first increase in the target federal funds rate from its current range of 0 to 1/4 percent will occur in the specified calendar year. In April 2012, the numbers of FOMC participants who judged that the first increase in the target federal funds rate would occur in 2012, 2013, 2014, and 2015 were, respectively, 3, 3, 7, and 4. In the lower panel, each shaded circle indicates the value (rounded to the nearest 1/4 percentage point) of an individual participant�s judgment of the appropriate level of the target federal funds rate at the end of the specified calendar year or over the longer run.
Accessible version of figure 2 | Return to figure 2
The Outlook for Inflation
Figures 3.C and 3.D provide information about the diversity of participants' views about the outlook for inflation. Relative to the assessments compiled in April, the projections for headline inflation shifted down in 2012, reflecting the declines in energy prices. The distributions of participants' projections for headline and core inflation in 2013 and 2014 were slightly lower than those reported in April.
Figure 3.A. Distribution of participants� projections for the change in real GDP, 2012�14 and over the longer run*
*NOTE: Definitions of variables are in the general note to table 1.
Accessible version of figure 3.A. | Return to figure 3.A.
Figure 3.B. Distribution of participants� projections for the unemployment rate, 2012�14 and over the longer run*
*NOTE: Definitions of variables are in the general note to table 1.
Accessible version of figure 3.B. | Return to figure 3.B.
Figure 3.C. Distribution of participants� projections for PCE inflation, 2012�14 and over the longer run*
*NOTE: Definitions of variables are in the general note to table 1.
Accessible version of figure 3.C. | Return to figure 3.C.
Figure 3.D. Distribution of participants� projections for core PCE inflation, 2012�14*
*NOTE: Definitions of variables are in the general note to table 1.
Accessible version of figure 3.D. | Return to figure 3.D.
Appropriate Monetary Policy
All participants reported levels for the appropriate target federal funds rate at the end of 2014 that were well below their estimates of the level expected to prevail in the longer run. Estimates of the longer-run target federal funds rate ranged from 3 to 4-1/2 percent, reflecting the Committee's inflation objective of 2 percent and participants' judgments about the longer-run equilibrium level of the real federal funds rate.
Participants also provided qualitative information on their views regarding the appropriate path of the Federal Reserve's balance sheet. Of the 12 participants whose assessments of appropriate monetary policy included additional balance sheet policies, 11 indicated that their assumptions incorporated an extension through the end of 2012 of the MEP, and 2 participants conditioned their economic forecasts on a new program of securities purchases. Two indicated that they would consider such purchases in the event that the economy did not make satisfactory progress in improving labor market conditions or in the event of a significant deterioration in the economic outlook or a further increase in downside risks to that outlook. Almost all participants assumed that the Committee would carry out the normalization of the balance sheet according to the principles approved at the June 2011 FOMC meeting. That is, prior to the first increase in the federal funds rate, the Committee would likely cease reinvesting some or all principal payments on securities in the System Open Market Account (SOMA), and it would likely begin sales of agency securities from the SOMA sometime after the first rate increase, aiming to eliminate the SOMA's holdings of agency securities over a period of three to five years. In general, participants linked their preferred start dates for the normalization process to their views for the appropriate timing for the first increase in the target federal funds rate. One participant who thought that the liftoff of the federal funds rate should occur relatively soon indicated that the reinvestment of maturing securities should continue for a time after liftoff.
The key factors informing participants' individual assessments of the appropriate setting for monetary policy included their judgments regarding the maximum level of employment, the extent to which current conditions had deviated from mandate-consistent levels, and participants' projections of the likely time horizon necessary to return employment and inflation to such levels. Several participants noted that their assessments of appropriate monetary policy reflected the subpar pace of the economic expansion and the persistent shortfall in aggregate demand since the 2007-09 recession, and two commented that the neutral level of the federal funds rate was likely somewhat below its historical norm. One participant expressed concern that a protracted period of very accommodative monetary policy could lead to a buildup of risks in the financial system. Participants also noted that because the appropriate stance of monetary policy depends importantly on the evolution of real activity and inflation over time, their assessments of the appropriate future path of the federal funds rate and the balance sheet could change if economic conditions were to evolve in an unexpected manner.
Figure 3.E details the distribution of participants' judgments regarding the appropriate level of the target federal funds rate at the end of each calendar year from 2012 to 2014 and over the longer run. Most participants judged that economic conditions would warrant maintaining the current low level of the federal funds rate through the end of 2013. Views on the appropriate level of the federal funds rate at the end of 2014 were more widely dispersed, with 11 participants seeing the appropriate level of the federal funds rate as 3/4 percentage point or lower and 4 of them seeing the appropriate rate as 2 percent or higher. Those who judged that a longer period of very accommodative monetary policy would be appropriate generally projected that the unemployment rate would remain further above its longer-run normal level at the end of 2014. In contrast, the 6 participants who judged that policy firming should begin in 2012 or 2013 indicated that the Committee would need to act soon to keep inflation near the FOMC's longer-run objective of 2 percent and to prevent a rise in inflation expectations.
Figure 3.E. Distribution of participants� projections for the target federal funds rate, 2012�14 and over the longer run*
*NOTE: The target federal funds rate is measured as the level of the target rate at the end of the calendar year or in the longer run.
Accessible version of figure 3.E. | Return to figure 3.E.
Uncertainty and Risks
A majority of participants reported that they saw the risks to their forecasts of real GDP growth as weighted toward the downside and, accordingly, the risks to their projections of the unemployment rate as tilted to the upside. The most frequently identified sources of risk were the situation in Europe, which many participants thought had the potential to slow global economic activity, particularly over the near term, and the fiscal situation in the United States.
Table 2. Average historical projection error ranges Percentage points
Note: Error ranges shown are measured as plus or minus the root mean squared error of projections for 1992 through 2011 that were released in the summer by various private and government forecasters. As described in the box "Forecast Uncertainty," under certain assumptions, there is about a 70 percent probability that actual outcomes for real GDP, unemployment, and consumer prices will be in ranges implied by the average size of projection errors made in the past. Further information is in David Reifschneider and Peter Tulip (2007), "Gauging the Uncertainty of the Economic Outlook from Historical Forecasting Errors," Finance and Economics Discussion Series 2007-60 (Washington: Board of Governors of the Federal Reserve System, November).
1. Definitions of variables are in the general note to table 1. Return to table
2. Measure is the overall consumer price index, the price measure that has been most widely used in government and private economic forecasts. Projection is percent change, fourth quarter of the previous year to the fourth quarter of the year indicated. Return to table
Most participants continued to judge the risks to their projections for inflation as broadly balanced, with several highlighting the recent stability of inflation expectations. However, five participants saw the risks to inflation as tilted to the downside, a larger number than in April; a couple of them noted that slack in resource markets could turn out to be greater or could put more downward pressure on inflation than they were anticipating. Two participants saw the risks to inflation as weighted to the upside, in light of concerns about U.S. fiscal imbalances, the current highly accommodative stance of monetary policy, or the Committee's ability to effectively remove policy accommodation when it becomes appropriate to do so.
Figure 4. Uncertainty and risks in economic projections*
*NOTE: For definitions of uncertainty and risks in economic projections, see the box "Forecast Uncertainty." Definitions of variables are in the general note to table 1.
Accessible version of figure 4 | Return to figure 4
Forecast Uncertainty
The economic projections provided by the members of the Board of Governors and the presidents of the Federal Reserve Banks inform discussions of monetary policy among policymakers and can aid public understanding of the basis for policy actions. Consider-able uncertainty attends these projections, however. The economic and statistical models and relationships used to help produce economic forecasts are necessarily imperfect descriptions of the real world, and the future path of the economy can be affected by myriad unforeseen developments and events. Thus, in setting the stance of monetary policy, participants consider not only what appears to be the most likely economic outcome as embodied in their projections, but also the range of alternative possibilities, the likelihood of their occurring, and the potential costs to the economy should they occur.
Table 2 summarizes the average historical accuracy of a range of forecasts, including those reported in past Monetary Policy Reports and those prepared by the Federal Reserve Board's staff in advance of meetings of the Federal Open Market Committee. The projection error ranges shown in the table illustrate the considerable uncertainty associated with economic forecasts. For example, suppose a participant projects that real gross domestic product (GDP) and total consumer prices will rise steadily at annual rates of, respectively, 3 percent and 2 percent. If the uncertainty attending those projections is similar to that experienced in the past and the risks around the projections are broadly balanced, the numbers reported in table 2 would imply a probability of about 70 percent that actual GDP would expand within a range of 2.0 to 4.0 percent in the current year, 1.4 to 4.6 percent in the second year, and 1.3 to 4.7 percent in the third year. The corresponding 70 percent confidence intervals for overall inflation would be 1.2 to 2.8 percent in the current year, 1.0 to 3.0 percent in the second year, and 0.9 to 3.1 percent in the third year.
Because current conditions may differ from those that prevailed, on average, over history, participants provide judgments as to whether the uncertainty attached to their projections of each variable is greater than, smaller than, or broadly similar to typical levels of forecast uncertainty in the past, as shown in table 2. Participants also provide judgments as to whether the risks to their projections are weighted to the upside, are weighted to the downside, or are broadly balanced. That is, participants judge whether each variable is more likely to be above or below their projections of the most likely outcome. These judgments about the uncertainty and the risks attending each participant's projections are distinct from the diversity of participants' views about the most likely outcomes. Forecast uncertainty is concerned with the risks associated with a particular projection rather than with divergences across a number of different projections.
As with real activity and inflation, the outlook for the future path of the federal funds rate is subject to considerable uncertainty. This uncertainty arises primarily because each participant's assessment of the appropriate stance of monetary policy depends importantly on the evolution of real activity and inflation over time. If economic conditions evolve in an unexpected manner, then assessments of the appropriate setting of the federal funds rate would change from that point forward.
14. Table 2 provides estimates of the forecast uncertainty for the change in real GDP, the unemployment rate, and total consumer price inflation over the period from 1992 to 2011. At the end of this summary, the box "Forecast Uncertainty" discusses the sources and interpretation of uncertainty in the economic forecasts and explains the approach used to assess the uncertainty and risks attending the participants' projections.