February 2008 Monetary Policy Report: Full Text
Overview of Monetary Policy and the Economic Outlook
The U.S. economy has weakened considerably since last July, when the Federal Reserve Board submitted its previous Monetary Policy Report to the Congress. Substantial strains have emerged in financial markets here and abroad, and housing-related activity has continued to contract. Also, further increases in the prices of crude oil and some other commodities have eroded the real incomes of U.S. households and added to business costs. Overall economic activity held up reasonably well into the autumn despite these adverse developments, but it decelerated sharply in the fourth quarter. Moreover, the outlook for 2008 has become less favorable since last summer, and considerable downside risks to economic activity have emerged. Headline consumer price inflation picked up in 2007 as a result of sizable increases in energy and food prices, while core inflation (which excludes the direct effects of movements in energy and food prices) was, on balance, a little lower than in 2006. Nonetheless, with inflation expectations anticipated to remain reasonably well anchored, energy and other commodity prices expected to flatten out, and pressures on resources likely to ease, monetary policy makers generally have expected inflation to moderate somewhat in 2008 and 2009. Under these circumstances, the Federal Reserve has eased the stance of monetary policy substantially since July.
The turmoil in financial markets that emerged last summer was triggered by a sharp increase in delinquencies and defaults on subprime mortgages. That increase substantially impaired the functioning of the secondary markets for subprime and nontraditional residential mortgages, which in turn contributed to a reduction in the availability of such mortgages to households. Partly as a result of these developments as well as continuing concerns about prospects for house prices, the demand for housing dropped further. In response to weak demand and high inventories of unsold homes, homebuilders continued to cut the pace of new construction in the second half of 2007, pushing the level of single-family starts in the fourth quarter more than 50 percent below the high reached in the first quarter of 2006.
After midyear, as losses on subprime mortgages and related structured investment products continued to mount, investors became increasingly skeptical about the likely credit performance of even highly rated securities backed by such mortgages. The loss of confidence reduced investors' overall willingness to bear risk and caused them to reassess the soundness of the structures of other financial products. That reassessment was accompanied by high volatility and diminished liquidity in a number of financial markets here and abroad. The pressures in financial markets were reinforced by banks' concerns about actual and potential credit losses. In addition, banks recognized that they might need to take a large volume of assets onto their balance sheets--including leveraged loans, some types of mortgages, and assets relating to asset-backed commercial paper programs--given their existing commitments to customers and the increased resistance of investors to purchasing some securitized products. In response to those unexpected strains, banks became more conservative in deploying their liquidity and balance sheet capacity, leading to tighter credit conditions for some businesses and households. The combination of a more negative economic outlook and a reassessment of risk by investors precipitated a steep fall in Treasury yields, a substantial widening of spreads on both investment-grade and speculative-grade corporate bonds, and a sizable net decline in equity prices.
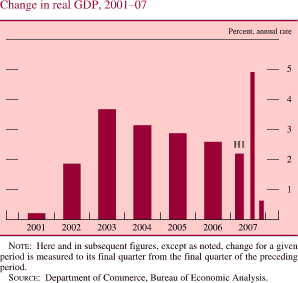
Initially, the spillover from the problems in the housing and financial markets to other sectors of the economy was limited. Indeed, in the third quarter, real gross domestic product (GDP) rose at an annual rate of nearly 5 percent, in part because of solid gains in consumer spending, business investment, and exports. In the fourth quarter, however, real GDP increased only slightly, and the economy seems to have entered 2008 with little momentum. In the labor market, growth in private-sector payrolls slowed markedly in late 2007 and January 2008. The sluggish pace of hiring, along with higher energy prices, lower equity prices, and softening home values, has weighed on consumer sentiment and spending of late. In addition, indicators of business investment have become less favorable recently. However, continued expansion of foreign economic activity and a lower dollar kept U.S. exports on a marked uptrend through the second half of last year, providing some offset to the slowing in domestic demand.
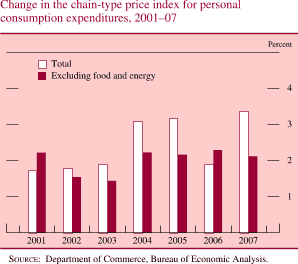
Overall consumer price inflation, as measured by the price index for personal consumption expenditures (PCE), stepped up to 3-1/2 percent over the four quarters of 2007 because of the sharp increase in energy prices and the largest rise in food prices in nearly two decades. Core PCE price inflation picked up somewhat in the second half of last year, but the increase came on the heels of some unusually low readings in the first half; core PCE price inflation over 2007 as a whole averaged slightly more than 2 percent, a little less than in 2006.
The Federal Reserve has taken a number of steps since midsummer to address strains in short-term funding markets and to foster its macroeconomic objectives of maximum employment and price stability. With regard to short-term funding markets, the Federal Reserve's initial actions when market turbulence emerged in August included unusually large open market operations as well as adjustments to the discount rate and to procedures for discount window borrowing and securities lending. As pressures intensified near the end of the year, the Federal Reserve established a Term Auction Facility to supply short-term credit to sound banks against a wide variety of collateral; in addition, it entered into currency swap arrangements with two other central banks to increase the availability of term dollar funds in their jurisdictions. With regard to monetary policy, the Federal Open Market Committee (FOMC) cut the target for the federal funds rate 50 basis points at its September meeting to address the potential downside risks to the broader economy from the ongoing disruptions in financial markets. The Committee reduced the target 25 basis points at its October meeting and did so again at the December meeting. In the weeks following that meeting, the economic outlook deteriorated further, and downside risks to growth intensified; the FOMC cut an additional 125 basis points from the target in January--75 basis points on January 22 and 50 basis points at its regularly scheduled meeting on January 29-30.
Since the previous Monetary Policy Report, the FOMC has announced new communications procedures, which include publishing enhanced economic projections on a timelier basis. The most recent projections were released with the minutes of the January FOMC meeting and are reproduced in part 4 of this report. Economic activity was expected to remain soft in the near term but to pick up later this year--supported by monetary and fiscal stimulus--and to be expanding at a pace around or a bit above its long-run trend by 2010. Total inflation was expected to be lower in 2008 than in 2007 and to edge down further in 2009. However, FOMC participants (Board members and Reserve Bank presidents) indicated that considerable uncertainty surrounded the outlook for economic growth and that they saw the risks around that outlook as skewed to the downside. In contrast, most participants saw the risks surrounding the forecasts for inflation as roughly balanced.
Domestic Developments
Although the U.S. economy had generally performed well in the first half of 2007, the economic landscape was subsequently reshaped by the emergence of substantial strains in financial markets in the United States and abroad, the intensifying downturn in the housing market, and higher prices for crude oil and some other commodities. Rising delinquencies on subprime mortgages led to large losses on related structured credit products, sparking concerns about the structures of other financial products and reducing investors' appetite for risk. The resulting dislocations generated unanticipated pressures on bank balance sheets, and those pressures combined with uncertainty about the size and distribution of credit losses to impair short-term funding markets. Consequently, the Federal Reserve and other central banks intervened to support liquidity and functioning in those markets. Amid a deteriorating economic outlook, and with downside risks increasing, Treasury yields declined markedly, and the Federal Open Market Committee cut the federal funds rate substantially. Meanwhile, risk spreads in a wide variety of credit markets increased considerably, and equity prices tumbled.
The financial turmoil did not appear to leave much of a mark on overall economic activity in the third quarter. Real GDP rose at an annual rate of nearly 5 percent, as solid gains in consumer spending, business investment, and exports more than offset the continuing drag from residential investment. In the fourth quarter, however, economic activity decelerated significantly, and the economy seems to have entered 2008 with little forward momentum. In part because of tighter credit conditions for households and businesses, the housing correction has deepened, and capital spending has softened. In addition, a number of factors, including steep increases in energy prices, lower equity prices, and softening home values, have started to weigh on consumer outlays. In the labor market, private hiring slowed sharply in late 2007 and January 2008. The increase in the price index for total personal consumption expenditures (PCE) picked up to 3-1/2 percent in 2007 as a result of sizable increases in food and energy prices. Core PCE inflation, though uneven over the course of the year, averaged a bit more than 2 percent during 2007 as a whole, a little less than the increase posted in 2006.
Selected Interest Rates, 2005-08, Target Federal Funds Rate
The data are daily and extend through February 21, 2008. The dates on the horizontal axis are those of regularly scheduled FOMC meetings.
Source: Federal Reserve.
Selected Interest Rates, 2005-08, Ten-Year Treasury Rate
The data are daily and extend through February 21, 2008. The ten-year Treasury rate is the constant-maturity yield based on the most actively traded securities.
Source: Department of the Treasury.
The Household Sector
Residential Investment and Finance
Economic activity in the past two years has been restrained by the ongoing contraction in the housing sector, and that restraint intensified in the second half of 2007. Home sales and prices softened significantly further, and homebuilders curtailed new construction in response to weak demand and elevated inventories. In all, the decline in residential investment reduced the annual growth rate of real GDP in the second half of 2007 by more than 1 percentage point, and the further drop in housing starts around the turn of the year suggests that the drag on the growth of real GDP remains substantial in early 2008.
Private Housing Starts, 1994-2007
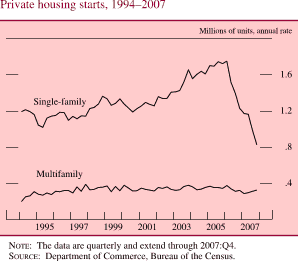
The data are quarterly and extend through 2007:Q4.
Source: Department of Commerce, Bureau of the Census.
The downturn in housing activity followed a multi-year period of soaring home sales and construction and rapidly escalating home prices. The earlier strength in housing reflected a number of factors. One was a low level of global real interest rates. Another was that many homebuyers apparently expected that home prices would continue to rise briskly into the indefinite future, thereby adding a speculative element to the market. In addition, toward the end of the boom, housing demand was supported by an upsurge in nonprime mortgage lending--in many cases fed by lax lending standards.1 By the middle of the decade, house prices had reached very high levels in many parts of the United States, and housing was becoming progressively less affordable. Declining affordability and waning optimism about future house price appreciation apparently started to weigh on the demand for housing, thereby causing sales to fall and the supply of unsold homes to ratchet up relative to the pace of sales. Against this backdrop, prices began to decelerate, further damping expectations of future price increases and exacerbating the downward pressure on demand.
Change in Prices of Existing Single-Family Houses, 1988-2007
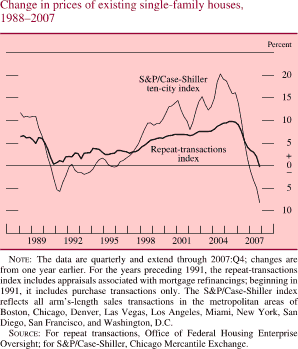
The data are quarterly and extend through 2007:Q4; changes are from one year earlier. For the years preceding 1991, the repeat-transactions index includes appraisals associated with mortgage refinancings; beginning in 1991, it includes purchase transactions only. The S&P/Case-Shiller index reflects all arm's-length sales transactions in the metropolitan areas of Boston, Chicago, Denver, Las Vegas, Los Angeles, Miami, New York, San Diego, San Francisco, and Washington, D.C.
Source: For repeat transactions, Office of Federal Housing Enterprise Oversight; for S&P/Case-Shiller, Chicago Mercantile Exchange.
Mortgage Rates, 2001-08
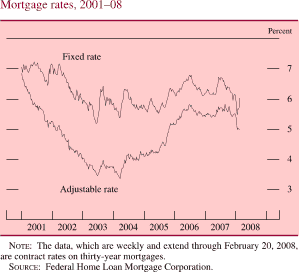
The data, which are weekly and extend through February 20, 2008, are contract rates on thirty-year mortgages.
Source: Federal Home Loan Mortgage Corporation.
House prices decelerated dramatically in 2006 and softened further in 2007. In many areas of the nation, existing home prices fell noticeably last year. For the nation as a whole, the OFHEO price index declined in the second half of the year after rising modestly in the first half; that measure had risen 4 percent in 2006 and about 9-1/2 percent in each of the two years before that.2 In the market for new homes, the constant-quality index of new home prices fell 2-1/4 percent over the four quarters of 2007. Moreover, many large homebuilders reportedly have been using not only price discounts but also nonprice incentives (for example, paying closing costs and including optional upgrades at no cost) in an effort to bolster sales of new homes and reduce inventories.
In all, the pace of sales of existing homes fell 30 percent between mid-2005 and the fourth quarter of 2007, and sales of new homes dropped by half. Builders cut production in response to the downshift in demand; by the fourth quarter of 2007, starts of single-family homes had fallen to an annual rate of just 826,000 units--less than half the quarterly high reached in early 2006. Nonetheless, the ongoing declines in sales prevented builders from making much progress in paring their bloated inventories of homes. In fact, although the number of unsold new homes has decreased, on net, since the middle of 2006, inventories have climbed sharply relative to sales. Measured relative to the average pace of sales over the three months ending in December, the months' supply of unsold new homes at the end of December stood at nine months, more than twice the upper end of the narrow range that had prevailed from 1997 to mid-2005.
The contraction in housing demand and construction was exacerbated in the second half of 2007 by the near elimination of nonprime mortgage originations and a tightening of lending standards on all types of mortgages. Indeed, large fractions of banks that responded to the Federal Reserve's Senior Loan Officer Opinion Survey on Bank Lending Practices reported that they had tightened lending standards over this period. Nonetheless, interest rates on prime conforming mortgages have declined on net: Rates on conforming thirty-year fixed-rate loans dropped from about 6-3/4 percent last summer to just above 6 percent at year-end. This year they dipped as low as 5-1/2 percent but have recently moved back up to about 6 percent, within the range that prevailed for much of the 2003-05 period.3 Rates on conforming adjustable-rate loans have also fallen significantly over the past several months and now stand at their lowest level since the end of 2005. Offered rates on fixed-rate jumbo loans, which ran up in the second half of 2007, have recently declined somewhat, on net.4 Even so, spreads between rates offered on these loans and conforming loans remain unusually wide.
The softness in home prices has played an important role in the ongoing deterioration in the credit quality of subprime mortgages. The deterioration was rooted in poor underwriting standards--and, in some cases, fraudulent and abusive lending practices--which were based in part on the assumption that house prices would continue to rise rapidly for some time to come. Many borrowers with weak credit histories took out adjustable-rate mortgages (subprime ARMs) with low initial rates; of those loans originated in 2005 and 2006, a historically large fraction had high loan-to-value ratios, which were often boosted by the addition of an associated junior lien or "piggyback" mortgage. When house prices decelerated, borrowers with high loan-to-value ratios on their loans were unable to build equity in their homes, making refinancing more difficult, and also faced the prospect of significantly higher mortgage payments after the initial rates on the loans reset.
Mortgage Delinquency Rates, 2001-07
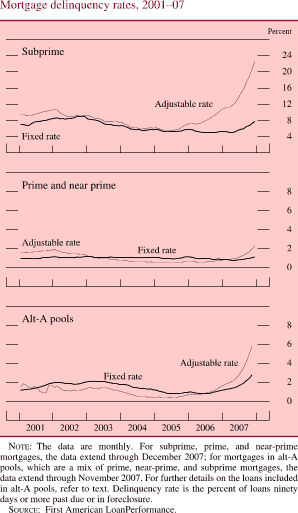
The data are monthly. For subprime, prime, and near-prime mortgages, the data extend through December 2007; for mortgages in alt-A pools, which are a mix of prime, near-prime, and subprime mortgages, the data extend through November 2007. For further details on the loans included in alt-A pools, refer to text. Delinquency rate is the percent of loans ninety days or more past due or in foreclosure.
Source: First American LoanPerformance.
Cumulative Defaults on Subprime 2/28 Loans, by Year of Origination, 2001-07
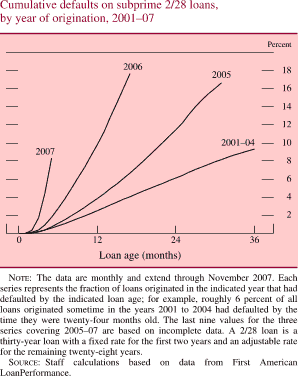
The data are monthly and extend through November 2007. Each series represents the fraction of loans originated in the indicated year that had defaulted by the indicated loan age; for example, roughly 6 percent of all loans originated sometime in the years 2001 to 2004 had defaulted by the time they were twenty-four months old. The last nine values for the three series covering 2005-07 are based on incomplete data. A 2/28 loan is a thirty-year loan with a fixed rate for the first two years and an adjustable rate for the remaining twenty-eight years.
Source: Staff calculations based on data from First American LoanPerformance.
Subprime ARMs account for about 7 percent of all first-lien mortgages outstanding. Delinquency rates on subprime ARMs began to increase in 2006, and by December 2007, more than one-fifth of these loans were seriously delinquent (that is, ninety days or more delinquent or in foreclosure). Moreover, an increasing fraction of subprime ARMs in the past few years have become seriously delinquent soon after they were originated and often well before the initial rate was due to reset.5 For subprime ARMs originated in 2006, about 10 percent had defaulted in the first twelve months, more than double the fraction for mortgages originated in earlier years. Furthermore, the path of the default rate for subprime ARMs originated in 2007 has run even higher. For subprime mortgages with fixed interest rates, delinquency rates have moved up significantly in recent months, to the upper end of their historical range.
For mortgages made to higher-quality borrowers (prime and near-prime mortgages), performance weakened somewhat in 2007, but it generally remains fairly solid. Although the rate of serious delinquency on ARMs has moved up, that on fixed-rate loans has stayed low. Serious delinquencies on jumbo mortgages--which often carry adjustable rates--have crept up slightly from very low levels.
The credit quality of loans that were securitized in pools marketed as "alt-A" has declined considerably. Such loans are typically made to higher-quality borrowers but have nontraditional amortization structures or other nonstandard features. Some of the loans are categorized as prime or near prime and others as subprime. The rate of serious delinquency on loans with adjustable rates in alt-A pools currently stands at almost 6 percent, far above the rates of less than 1 percent seen as recently as early 2006. The rate of serious delinquency on fixed-rate alt-A loans has also increased in recent months.
The continued erosion in the quality of mortgage credit has led to a rising number of initial foreclosure filings; indeed, such filings were made at a record pace in the third quarter of 2007. Foreclosures averaged about 360,000 per quarter over the first three quarters of 2007, compared with a rate of about 235,000 in the corresponding quarters of 2006. As was the case in 2006, more than half of the foreclosure filings in 2007 were subprime mortgages despite the relatively smaller share of such loans in total mortgages outstanding. In some cases, falling prices may have tempted more-speculative buyers with little or no equity to walk away from their properties. Foreclosures have risen most in areas where home prices have been falling after a period of rapid increase; foreclosures also have mounted in some regions where economic growth has been below the national average.
Avoiding foreclosure--even if it involves granting concessions to the borrower--can be an important loss-mitigation strategy for financial institutions. To limit the number of delinquencies and foreclosures, financial institutions can use a variety of approaches, including renegotiating the timing and size of rate resets. A complication in implementing such approaches is that the loans have often been packaged and sold in securitized pools that are owned by a dispersed group of investors, which makes the task of coordinating renegotiation among all affected parties difficult. In part to address the challenges in modifying securitized loans, counselors, servicers, investors, and other mortgage market participants joined in a collaborative effort, called the Hope Now Alliance, to facilitate cross-industry solutions to the problem.6 Separately, the Federal Reserve has directly responded in a number of ways to the problems with mortgage credit quality (described in the box entitled "The Federal Reserve's Responses to the Subprime Mortgage Crisis").
Most commercial banks responding to the Federal Reserve's January 2008 Senior Loan Officer Opinion Survey indicated that loan-by-loan modifications based on individual borrowers' circumstances were an important part of their loss-mitigation strategies. Almost two-thirds of respondents indicated that they would consider refinancing the loans of their troubled borrowers into other mortgage products at their banks. About one-third of respondents said that streamlined modifications of the sort proposed by the Hope Now Alliance were important to their strategies for limiting losses.
All of the factors discussed above--the drop in home sales, softer house prices, and tighter lending standards (especially for subprime and alternative mortgage products)--combined to reduce the growth of household mortgage debt to an annual rate of about 7-1/2 percent over the first three quarters of 2007, down from 11-1/4 percent in 2006. Growth likely slowed further in the fourth quarter.
Consumer Spending and Household Finance
Consumer spending held up reasonably well in the second half of 2007, though it moderated some in the fourth quarter. Spending continued to be buoyed by solid gains in aggregate wages and salaries as well as by the lagged effects of the increases in household wealth in 2005 and 2006. However, other influences on spending have become less favorable. Job gains have slowed lately, household wealth has been damped by the softening in home prices as well as by recent declines in equity values, and consumers' purchasing power has been sapped by sharply higher energy prices. Moreover, consumer sentiment has fallen appreciably, and although consumer credit has remained available to most borrowers, credit standards for many types of loans have been tightened.
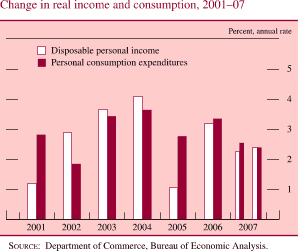
Change in Real Income and Consumption, 2001-07
Source: Department of Commerce, Bureau of Economic Analysis.
Consumer Sentiment, 1994-2008
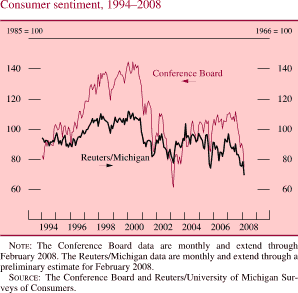
The Conference Board data are monthly and extend through February 2008. The Reuters/Michigan data are monthly and extend through a preliminary estimate for February 2008.
Source: The Conference Board and Reuters/University of Michigan Surveys of Consumers.
Real personal consumption expenditures (PCE) increased at an annual rate of 2-3/4 percent in the third quarter, a little above the average pace during the first half of the year; in the fourth quarter, PCE growth slowed to 2 percent. With the notable exception of outlays for new light motor vehicles (cars, sport-utility vehicles, and pickup trucks)--which were well maintained through year-end--the deceleration in spending in the fourth quarter was widespread. PCE appears to have entered 2008 on a weak trajectory, as sales of light vehicles sagged in January and spending on other goods was soft.
The Federal Reserve's Responses to the Subprime Mortgage Crisis
The sharp increases in subprime mortgage loan delinquencies and foreclosures over the past year have created personal, economic, and social distress for many homeowners and communities. The Federal Reserve has taken a number of actions that directly respond to these problems. Some of the efforts are intended to help distressed subprime borrowers and limit preventable foreclosures, and others are aimed at reducing the likelihood of such problems in the future.
Home losses through foreclosure can be reduced if financial institutions work with borrowers who are having difficulty meeting their mortgage payment obligations. Foreclosure cannot always be avoided, but in many cases prudent loss-mitigation techniques that preserve homeownership are less costly to lenders than foreclosure. In 2007, the Federal Reserve and other banking agencies encouraged mortgage lenders and mortgage servicers to pursue prudent loan workouts through such measures as modification of loans, deferral of payments, extension of loan maturities, capitalization of delinquent amounts, and conversion of adjustable-rate mortgages (ARMs) into fixed-rate mortgages or fully indexed, fully amortizing ARMs.1
The Federal Reserve has also collaborated with community groups to help homeowners avoid foreclosure. Staff members throughout the Federal Reserve System are working to identify localities that are likely to experience the highest rates of foreclosure; the resulting information is helping local groups to better focus their borrower outreach efforts. In addition, the Federal Reserve actively supports NeighborWorks America, a national nonprofit organization that has been helping thousands of mortgage borrowers facing current or potential distress. Federal Reserve staff members have worked closely with this organization and its local affiliates on an array of foreclosure prevention efforts, and a member of the Federal Reserve Board serves on its board of directors. Other contributions include efforts by Reserve Banks to convene workshops for stakeholders to develop community-based solutions to mortgage delinquencies in their areas.
The Federal Reserve has taken important steps aimed at avoiding future problems in subprime mortgage markets while still preserving responsible subprime lending and sustainable homeownership. In coordination with other federal supervisory agencies and the Conference of State Bank Supervisors, the Federal Reserve issued principles-based guidance on subprime mortgages last summer.2 The guidance is designed to help ensure that borrowers obtain adjustable-rate mortgages that they can afford to repay and can refinance without prepayment penalty for a reasonable period before the first interest rate reset. The Federal Reserve issued similar guidance on nontraditional mortgages in 2006.3
The Federal Reserve is working to help safeguard borrowers in their interactions with mortgage lenders. In support of this effort, in December 2007 the Federal Reserve used its authority under the Home Ownership and Equity Protection Act of 1994 to propose new rules that address unfair or deceptive mortgage lending practices. This proposal addresses abuses related to prepayment penalties, failure to escrow for taxes and insurance, problems related to stated-income and low-documentation lending, and failure to give adequate consideration to a borrower's ability to repay. The proposal includes other protections as well, such as rules designed to curtail deceptive mortgage advertising and to ensure that consumers receive mortgage disclosures at a time when the information is likely to be the most useful to them.
The Federal Reserve is also currently undertaking a broad and rigorous review of the Truth in Lending Act, including extensive consumer testing of loan disclosure documents. After a similar comprehensive analysis of disclosures related to credit card and other revolving credit arrangements, the Board issued a proposal in May 2007 to require such disclosures to be clearer and easier to understand. Like the credit card review, the review of mortgage disclosures will be lengthy given the critical need for field testing, but the process should ultimately help more consumers make appropriate choices when financing their homes.
Finally, strong uniform oversight of all mortgage lenders is critical to avoiding future problems in mortgage markets. Regulatory oversight of the mortgage industry has become more challenging as the breadth and depth of the market has grown over the past decade and as the role of nonbank mortgage lenders, particularly in the subprime market, has increased. In response, the Federal Reserve, together with other federal and state agencies, launched a pilot program last summer focused on selected nondepository lenders with significant subprime mortgage operations.4 The program will review compliance with consumer protection regulations and impose corrective or enforcement actions as warranted.
Footnotes
1. Board of Governors of the Federal Reserve System (2007), "Working with Mortgage Borrowers," Division of Banking Supervision and Regulation, Supervision and Regulation Letter SR 07-6 (April 17); and "Statement on Loss Mitigation Strategies for Servicers of Residential Mortgages," Supervision and Regulation Letter SR 07-16 (September 5). Return to Text
2. Board of Governors of the Federal Reserve System (2007), "Statement on Subprime Mortgage Lending," Division of Banking Supervision and Regulation, Supervision and Regulation Letter SR 07-12 (July 24). Return to Text
3. Board of Governors of the Federal Reserve System (2006), "Interagency Guidance on Nontraditional Mortgage Product Risks," Division of Banking Supervision and Regulation, Supervision and Regulation Letter SR 06-15 (October 10). Return to Text
4. The other agencies collaborating on the effort are the Office of Thrift Supervision, the Federal Trade Commission, the Conference of State Bank Supervisors, and the American Association of Residential Mortgage Regulators. Return to Text
Growth in real disposable personal income--that is, after-tax income adjusted for inflation--was sluggish in the second half of 2007. Although aggregate wages and salaries rose fairly briskly in nominal terms over that period, the purchasing power of the nominal gain was eroded by the energy-driven upturn in consumer price inflation in the fall. Indeed, for many workers, increases in real wages over 2007 as a whole were modest, once again falling short of the rise in aggregate labor productivity. For example, average hourly earnings, a measure of wages for production or nonsupervisory workers, increased only 1/2 percent over the four quarters of 2007 after accounting for the rise in the overall PCE price index. Moreover, for some workers, real wages actually declined: Real average hourly earnings in manufacturing edged down about 3/4 percent last year, while for retail trade--an industry that typically pays relatively low wages--this measure of real wages fell about 2 percent.
On the whole, household balance sheets remained in good shape in 2007, although they weakened late in the year. The aggregate net worth of households rose modestly through the third quarter, as increases in equity values more than offset the effect of softening home prices. However, preliminary data suggest that the value of household wealth fell in the fourth quarter, and as a result the ratio of household wealth to disposable income--a key influence on consumer spending--ended the year well below its level at the end of 2006. Nonetheless, because changes in net worth tend to influence consumption with a lag, the increases in wealth during 2005 and 2006 likely helped sustain spending in 2007. In the fourth quarter, the personal saving rate was just a shade above zero, about in line with its average value since 2005.
Wealth-to-Income Ratio, 1984-2007
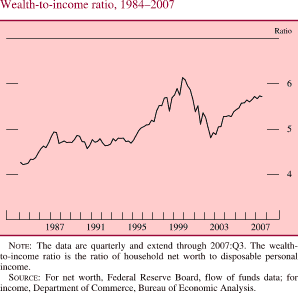
The data are quarterly and extend through 2007:Q3. The wealth-to-income ratio is the ratio of household net worth to disposable personal income.
Source: For net worth, Federal Reserve Board, flow of funds data; for income, Department of Commerce, Bureau of Economic Analysis.
Personal Saving Rate, 1984-2007
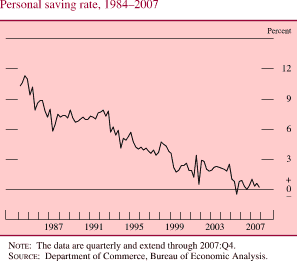
The data are quarterly and extend through 2007:Q4.
Source: Department of Commerce, Bureau of Economic Analysis.
Overall household debt increased at an annual rate of about 7-1/4 percent through the third quarter of 2007, a notable deceleration from the 10-1/4 percent pace in 2006; household debt likely slowed further in the fourth quarter. Because the growth of household debt about matched the growth in nominal disposable personal income through the third quarter, and net changes in interest rates on mortgage debt to that point were small, the ratio of financial obligations to disposable personal income was about flat.
Household Financial Obligations Ratio, 1992-2007
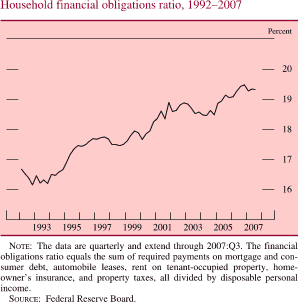
The data are quarterly and extend through 2007:Q3. The financial obligations ratio equals the sum of required payments on mortgage and consumer debt, automobile leases, rent on tenant-occupied property, homeowner's insurance, and property taxes, all divided by disposable personal income.
Source: Federal Reserve Board.
Consumer (nonmortgage) borrowing picked up a bit in 2007 to 5-1/2 percent, perhaps reflecting some substitution of consumer credit for mortgage debt. The pickup in consumer debt was mostly attributable to faster growth in revolving credit, a pattern consistent with the results of the Federal Reserve's Senior Loan Officer Opinion Survey. Banks, on net, reported easing lending standards on credit cards over the first half of 2007 and reported little change in those standards on net over the second half of the year. In contrast, significant fractions of respondents in the second half of 2007 reported that they had tightened standards and terms on other consumer loans, a change that may have contributed to a slowing in the growth of nonrevolving loans over the final months of 2007. Average interest rates on credit cards generally moved down in the second half of the year, but by less than the short-term market interest rates on which they are often based. Interest rates on new auto loans at banks and at auto finance companies have also declined some in recent months.
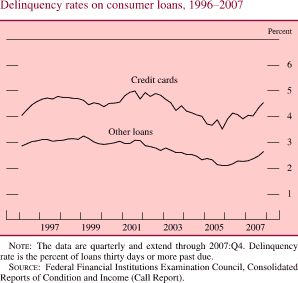
Indicators of the credit quality of consumer loans suggest that it has weakened but generally remains sound. Over the second half of the year, delinquency rates on consumer loans at commercial banks increased, but from relatively moderate recent levels. Meanwhile, delinquency rates at captive auto finance companies increased somewhat but are well below previous highs. Although household bankruptcy filings remained low relative to the levels seen before the changes in bankruptcy law implemented in late 2005, the bankruptcy rate rose modestly over the first nine months of 2007.
Delinquency Rates on Consumer Loans, 1996-2007
The data are quarterly and extend through 2007:Q4. Delinquency rate is the percent of loans thirty days or more past due.
Source: Federal Financial Institutions Examination Council, Consolidated Reports of Condition and Income (Call Report).
The issuance of asset-backed securities (ABS) tied to credit card loans and auto loans (consumer loan ABS) has remained robust. Spreads of yields on consumer loan ABS over comparable-maturity swap rates have moved up considerably since July; the rise pushed spreads on two-year BBB-rated consumer loan ABS to almost double their previous peaks in late 2002. Spreads on two-year AAA-rated consumer loan ABS jumped to between 60 basis points and 100 basis points after having been near zero for most of the decade, perhaps in part as a result of investors' general reassessment of the risk in structured credit products.
The Business Sector
Fixed Investment
Real business fixed investment (BFI) rose at an annual rate of 8-1/2 percent in the second half of 2007, largely because of a double-digit rise in expenditures on nonresidential construction. Investment in equipment and software (E&S), which had accounted for virtually all of the growth in real BFI from 2003 to 2005, has been erratic since early 2006 but, on balance, has decelerated noticeably. On the whole, the economic and financial conditions that influence capital spending were fairly favorable in mid-2007, but they subsequently worsened as the outlook for sales and profits soured and as credit conditions for some borrowers tightened. A bright spot, however, is that many firms still have ample cash on hand to fund potential projects.
On average, real outlays on E&S rose at an annual rate of 5 percent in the second half of 2007; in the first half, these outlays had risen just 2-1/2 percent, in part because of a sharp downswing in outlays on motor vehicles.7 Real investment in high-technology performed well in the second half, with further increases in all major components (computers, communications equipment, and software). Real outlays on equipment other than high-tech and transportation (a broad category that accounts for nearly half of investment in E&S when measured in nominal terms) posted a solid gain in the third quarter. However, those outlays edged down in the fourth quarter, and the relatively slow pace of orders, along with the downbeat tone in recent surveys of business conditions, suggests that the softness in spending has extended into early 2008.
Meanwhile, real outlays on nonresidential construction remained on a strong uptrend. Some of the recent strength likely represents a catch-up from the prolonged weakness in this sector in the first half of the decade. With the notable exception of the non-office commercial sector--where spending has been about flat since mid-2007--all major types of building continued to exhibit considerable vigor in the second half. In general, the nonfinancial fundamentals affecting nonresidential construction remain favorable: Vacancy rates for office and industrial buildings have fallen appreciably over the past few years despite the addition of a good deal of available space; and, although the vacancy rate for retail buildings has moved up somewhat of late, it remains well below its cyclical highs in 1991 and 2003. However, funding has reportedly become more difficult to obtain in recent months, especially for speculative projects, and the slowing in aggregate output and employment is likely to limit the demand for nonresidential space in coming quarters. Meanwhile, real outlays for drilling and mining structures have continued to rise in response to high prices for petroleum and natural gas.
Inventory Investment
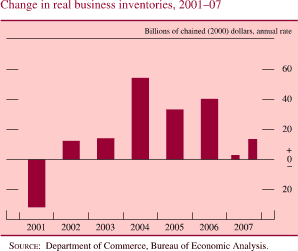
Although inventory imbalances had cropped up in a number of industries in late 2006, overhangs were largely eliminated in the first half of 2007, and firms generally continued to keep a tight rein on stocks in the second half. In the motor vehicle sector, manufacturers pursued an aggressive strategy of production adjustments to keep dealer stocks reasonably well aligned with sales. In December 2007, days' supply of light vehicles stood at a comfortable sixty-four days--though it ticked up in January because of the drop in sales noted earlier. Apart from motor vehicles, real nonfarm inventory investment was a modest $10 billion (annual rate) in the first half of 2007; it stayed around that rate in the third quarter and appears to have remained modest in the fourth quarter as manufacturing firms adjusted production promptly in response to signs of softening demand. With only a few exceptions--mostly related to the ongoing weakness in construction and motor vehicle production--book-value inventory-sales ratios in December seemed in line with historical trends. Moreover, businesses surveyed in January by the Institute for Supply Management reported that their customers were generally satisfied with their current level of stocks.
Change in Real Business Inventories, 2001-07
Source: Department of Commerce, Bureau of Economic Analysis.
Corporate Profits and Business Finance
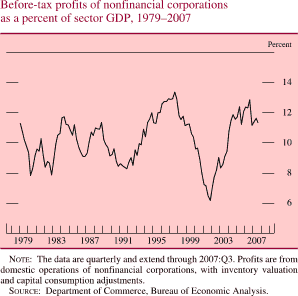
Four-quarter growth in economic profits for all U.S. corporations came in at about 2 percent in the third quarter of 2007, with the entire gain attributable to a large increase in receipts from foreign subsidiaries. The share of profits in the GDP of the nonfinancial sector peaked in the third quarter of 2006, near its previous high reached in 1997, and has since receded. For S&P 500 firms, operating earnings per share in the third quarter came in about 6 percent below year-earlier levels.8 Data from about 80 percent of those firms and analysts' estimates for the rest indicate that operating earnings per share in the fourth quarter fell more than 20 percent from the fourth quarter of 2006. Earnings per share among the group's financial firms are estimated to have been negative, primarily because of asset write-downs; in contrast, earnings per share of the nonfinancial firms appear to have increased about 13 percent.
Before-Tax Profits of Nonfinancial Corporations as a Percent of Sector GDP, 1979-2007
The data are quarterly and extend through 2007:Q3. Profits are from domestic operations of nonfinancial corporations, with inventory valuation and capital consumption adjustments.
Source: Department of Commerce, Bureau of Economic Analysis.
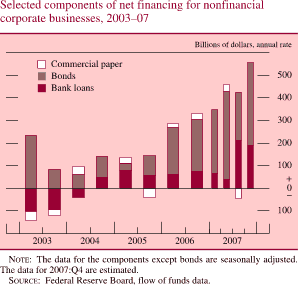
Nonfinancial business debt is estimated to have grown about 11 percent in 2007, buoyed by robust merger and acquisition activity. Net corporate bond issuance was strong throughout the year, although high-yield issuance declined after midyear, as yields on such bonds increased and spreads over yields on Treasury securities of comparable maturity widened to levels not seen since late 2002. The amount of outstanding nonfinancial commercial paper was about flat, on net, over 2007, held down mostly by runoffs of lower-tier paper in the second half of the year as the market for such paper came under pressure. After an unprecedented amount of issuance of leveraged syndicated loans over the first half of 2007, issuance declined considerably in the second half of the year, when demand by nonbank investors for those loans fell off. Commercial and industrial (C&I) loans at banks expanded briskly in 2007 as underlying demand for bank-intermediated business credit seemed to remain solid and banks took onto their balance sheets loans that had been intended for syndication. In the Senior Loan Officer Opinion Surveys taken in October 2007 and January 2008, considerable net fractions of banks reported charging wider spreads on C&I loans--the loan rate less the bank's cost of funds--the first such tightening in several years. Large fractions of banks also indicated that they had tightened lending standards. Most of the banks that tightened terms and standards indicated that they had done so in response to a less favorable or more uncertain economic outlook and a reduced tolerance for risk. A lesser fraction--about one-fourth--cited concerns about the liquidity or capital position of their own banks as reasons for tightening.
Selected components of net financing for nonfinancial corporate businesses, 2003-07
The data for the components except bonds are seasonally adjusted. The data for 2007:Q4 are estimated.
Source: Federal Reserve Board, flow of funds data.
Net Percentage of Domestic Banks Tightening Standards and Increasing Spreads on Commercial and Industrial Loans to Large and Medium-Sized Borrowers, 1992-2008
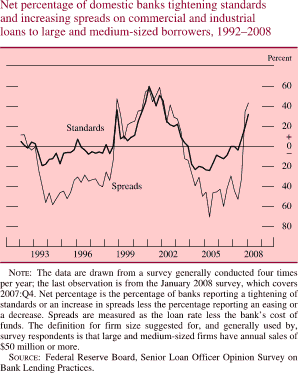
The data are drawn from a survey generally conducted four times per year; the last observation is from the January 2008 survey, which covers 2007:Q4. Net percentage is the percentage of banks reporting a tightening of standards or an increase in spreads less the percentage reporting an easing or a decrease. Spreads are measured as the loan rate less the bank's cost of funds. The definition for firm size suggested for, and generally used by, survey respondents is that large and medium-sized firms have annual sales of $50 million or more.
Source: Federal Reserve Board, Senior Loan Officer Opinion Survey on Bank Lending Practices.
Gross equity issuance picked up in 2007 on an increase in the pace of seasoned offerings. Nonetheless, record volumes of share repurchases and cash-financed mergers and acquisitions pushed net equity retirements even higher in 2007 than in 2006.
Financing Gap and Net Equity Retirement at Nonfinancial Corporations, 1992-2007
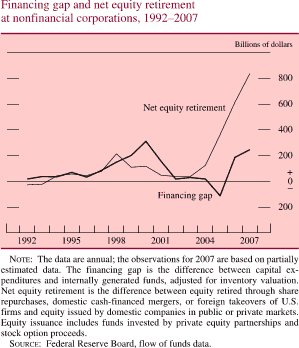
The data are annual; the observations for 2007 are based on partially estimated data. The financing gap is the difference between capital expenditures and internally generated funds, adjusted for inventory valuation. Net equity retirement is the difference between equity retired through share repurchases, domestic cash-financed mergers, or foreign takeovers of U.S. firms and equity issued by domestic companies in public or private markets. Equity issuance includes funds invested by private equity partnerships and stock option proceeds.
Source: Federal Reserve Board, flow of funds data.
The credit quality of nonfinancial corporations remained strong. The six-month trailing bond default rate stayed near zero through January 2008. The delinquency rate on C&I loans at commercial banks at the end of 2007 remained near the bottom of its historical range, but it trended higher over the year. Charge-offs on C&I loans at banks also increased in 2007, particularly in the fourth quarter. Rating downgrades of corporate bonds were modest through the fourth quarter, and over the year the fraction of debt that was downgraded roughly equaled the fraction that was upgraded. For public firms, balance sheet liquidity remained at a high level through the third quarter of 2007, and leverage stayed very low despite robust borrowing and surging retirements of equity.
Default Rate on Outstanding Corporate Bonds, 1992-2008
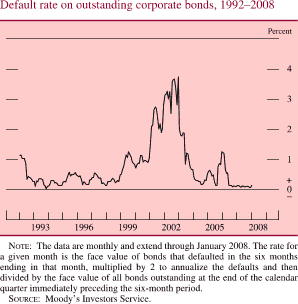
The data are monthly and extend through January 2008. The rate for a given month is the face value of the bonds that defaulted in the six months ending that month, multiplied by 2 to annualize the defaults and then divided by the face value of all bonds outstanding at the end of the calendar quarter immediately preceding the six-month period.
Source: Moody's Investor Service.
Net Interest Payments of Nonfinancial Corporations as a Percent of Cash Flow, 1979-2007
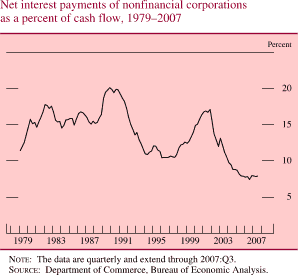
The data are quarterly and extend through 2007:Q3.
Source: Department of Commerce, Bureau of Economic Analysis.
Commercial real estate debt continued to expand briskly in 2007, reflecting in part strong investment in nonresidential structures, but the overall pace tapered off some in the second half of the year. As noted above, readings on some market fundamentals for existing structures--for example, vacancy rates and rents--remained solid. Similarly, the latest data for commercial mortgages held by life insurance companies or by issuers of commercial mortgage-backed securities (CMBS)--mortgages that mostly finance existing structures--show little change in delinquency rates in recent quarters.
In contrast, the delinquency rate on commercial mortgages held by banks about doubled over the course of 2007, reaching almost 2-3/4 percent. The loan performance problems were the most striking for construction and land development loans--especially for those that finance residential development--but some increase in delinquency rates was also apparent for loans backed by nonfarm, nonresidential properties and multifamily properties. In the most recent Senior Loan Officer Opinion Survey, large fractions of banks reported having tightened standards and terms on commercial real estate loans. Among the most common reasons cited by those that tightened credit conditions were a less favorable or more uncertain economic outlook, a worsening of commercial real estate market conditions in the areas where the banks operate, and a reduced tolerance for risk.
Delinquency Rates on Commercial Real Estate Loans at Banks, 1991-2007
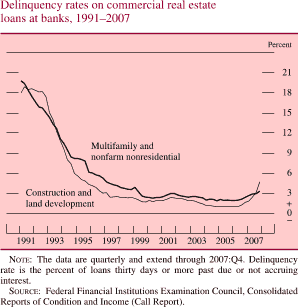
The data are quarterly and extend through 2007:Q4. Delinquency rate is the percent of loans thirty days or more past due or not accruing interest.
Source: Federal Financial Institutions Examination Council, Consolidated Reports of Condition and Income (Call Report).
Moreover, despite the generally solid performance of commercial mortgages in securitized pools, spreads of yields on BBB-rated CMBS over comparable-maturity swap rates soared, and spreads on AAA-rated tranches of those securities rose to unprecedented levels. The widening of spreads reportedly reflected heightened concerns regarding the underwriting standards for commercial mortgages over the past few years and likely also investors' general wariness of structured finance products.
Ten-Year Investment-Grade Commercial Mortgage-Backed Securities Over Swaps, by Securities Rating, 1997-2008
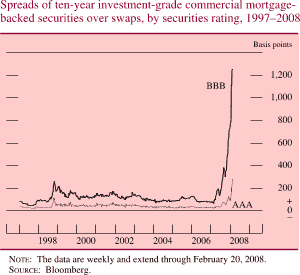
The data are weekly and extend through February 20, 2008.
Source: Bloomberg.
Issuance of CMBS in 2007 topped the pace of 2006. It was fueled by leveraged buyouts of real estate investment trusts in the first half of the year, but issuance slowed to a trickle over the final four months of the year on tighter underwriting standards and the higher required yields. Nonetheless, the still-steady growth of commercial real estate debt indicates that, thus far, borrowers have found alternative funding sources for projects.
The Government Sector
Federal Government
The deficit in the federal unified budget stood at $162 billion in fiscal year 2007, roughly $250 billion below the recent high reached in fiscal 2004 and equal to just 1-1/4 percent of nominal GDP. However, growth in revenues has slowed since last summer, and growth in outlays has quickened. Given those developments, the deficit during the first four months of fiscal 2008 (October 2007 to January 2008) was larger than it had been during the comparable period of fiscal 2007. Over the remainder of fiscal 2008, a slow pace of economic activity and the revenue loss associated with the Economic Stimulus Act of 2008 are expected to boost the deficit.
Nominal federal receipts have decelerated sharply since posting double-digit advances in fiscal years 2005 and 2006: They rose less than 7 percent in fiscal 2007 and have slowed substantially further thus far in fiscal 2008. The deceleration has been most pronounced in corporate receipts, which barely increased in fiscal 2007 after three years of exceptional growth and have fallen well below year-earlier levels so far in fiscal 2008; the downturn has reflected the recent softness in corporate profits. In addition, growth in individual income tax receipts has moderated from the rapid rates seen around the middle of the decade. Nonetheless, total receipts grew faster than nominal GDP for the third year in a row in fiscal 2007 and reached 18-3/4 percent of GDP, slightly above the average of the past forty years.
Federal Receipts and Expenditures, 1987-2007
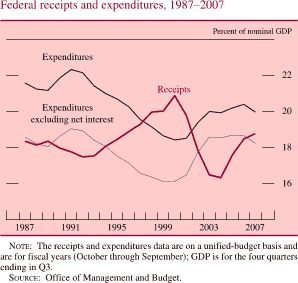
The receipts and expenditures data are on a unified-budget basis and are for fiscal years (October through September); GDP is for the four quarters ending in Q3.
Source: Office of Management and Budget.
Nominal federal outlays rose less than 3 percent in fiscal 2007 after having risen about 7-1/2 percent in each of the two preceding years. In large part, the slowing in 2007 reflected a number of transitory factors--most notably, the tapering off of expenditures for flood insurance and disaster relief related to the 2005 Gulf Coast hurricanes, which had produced a noticeable bulge in spending in fiscal 2006. So far in fiscal 2008, sharp increases in outlays for defense and net interest have helped push spending 8 percent above its year-earlier level.
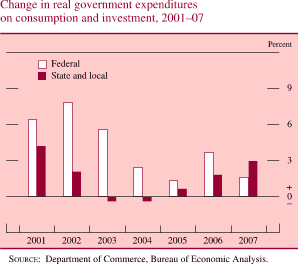
As measured in the national income and product accounts (NIPA), real federal expenditures on consumption and gross investment--the part of federal spending that is a direct component of GDP--rose at an annual rate of 3-1/2 percent, on average, in the second half of calendar 2007 after having been unchanged in the first half. The step-up was concentrated in real defense spending, which tends to be erratic from quarter to quarter and rose at an annual rate of 4-1/2 percent in the second half, somewhat above its average pace over the past three years.
Change in Real Government Expenditures on Consumption and Investment, 2001-07
Source: Department of Commerce, Bureau of Economic Analysis.
Federal debt rose at an annual rate of almost 5 percent over the four quarters of calendar year 2007, a bit faster than the roughly 4 percent increase in 2006. The ratio of federal debt held by the public to nominal GDP remained in the narrow range around 36-1/2 percent seen in recent years. The Treasury's decision in May to discontinue auctions of three-year nominal notes elicited little reaction in financial markets. The Treasury also trimmed some auction sizes for a few other coupon securities over the first three quarters of the year as the narrower deficit reduced borrowing needs. Data suggest that the proportion of nominal coupon securities purchased at Treasury auctions by foreign official institutions edged down over the second half of 2007, but the proportion has changed little, on net, since mid-2005.
Federal Government Debt held by the Public, 1960-2007
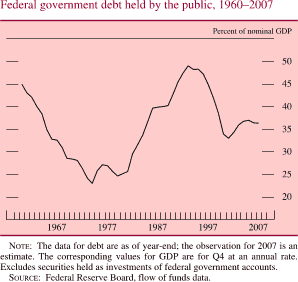
The data for debt are as of year-end; the observation for 2007 is an estimate. The corresponding values for GDP are for Q4 at an annual rate. Excludes securities held as investments of federal government accounts.
Source: Federal Reserve Board, flow of funds data.
State and Local Government
The fiscal condition of state and local governments appears to have lost some luster in 2007 after improving significantly between the early part of the decade and 2006. Indeed, for the state and local sector as a whole, net saving as measured in the NIPA, which is broadly similar to the surplus in an operating budget, fell from a recent high of $25 billion in 2006 to roughly zero, on average, during the first three quarters of 2007. The downshift occurred as revenue increases tailed off after a period of hefty gains and as nominal expenditures--especially on energy and health care--rose sharply. Recent information from individual states points to a good deal of unevenness in current budget conditions. Some states--especially those in agricultural and energy-producing regions--continue to enjoy strong fiscal positions. Others, however, are reporting sizable shortfalls in revenues, in part because sales tax collections are being hit hard by the weakness in purchases of housing-related items. In these circumstances, some states may have to cut spending or raise taxes to satisfy their balanced-budget requirements. At the local level, property tax receipts apparently were bolstered in 2007 by the earlier run-up in real estate values, but the deceleration in house prices will likely slow the rise in local revenues down the road. Moreover, many state and local governments expect to face significant structural imbalances in their budgets in coming years as a result of the ongoing pressures from Medicaid and the need to provide pensions and health care to their retired employees.
State and Local Government Net Saving, 1987-2007
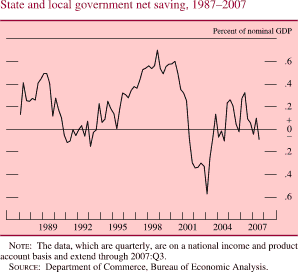
The data, which are quarterly, are on a national income and product account basis and extend through 2007:Q3.
Source: Department of Commerce, Bureau of Economic Analysis.
According to the NIPA, real expenditures on consumption and gross investment by state and local governments continued to expand briskly in the second half of 2007. Much of the strength was in construction spending, which picked up speed early last year after having been essentially flat between 2002 and 2006. Meanwhile, real outlays for current operations remained on the moderate uptrend that has been evident since 2006.
Boosted by spending on education and industrial aid, borrowing for new capital expenditures by state and local governments was very strong in 2007. Refundings in advance of retirements were brisk in the early part of the year as issuers locked in low interest rates, but refundings subsided in the second half as a result of higher volatility and reduced liquidity in the municipal bond market. By contrast, short-term borrowing picked up a bit during the second half of the year, possibly because of some deterioration in state and local budgets.
Municipal issuers are benefiting from lower interest rates, as bond yields have declined some since midyear. However, investors reportedly have become increasingly concerned about the weaker fiscal outlooks for many state and local governments and the condition of municipal bond insurers. Partly as a result of those developments, the ratio of an index of municipal bond yields to the yield on comparable-maturity Treasuries has climbed to the top end of its historical range.
Some indicators of credit quality in the municipal bond sector have begun pointing to greater weakness in recent months. Rating upgrades have slowed while downgrades have risen. A substantial number of revenue bonds for projects insured by a subsidiary of a major investment bank were downgraded in October.In January another group of bonds was downgraded because of the downgrade of their insurer.
National Saving
Total net national saving--that is, the saving of households, businesses, and governments excluding depreciation charges--was equal to about 1-1/2 percent of nominal GDP, on average, during the first three quarters of 2007. The drain on national saving from the federal budget deficit was smaller than it had been a few years earlier. However, net business saving receded somewhat from the relatively high levels of the preceding few years, and personal saving was very low for the third consecutive year.
Net Saving, 1987-2007
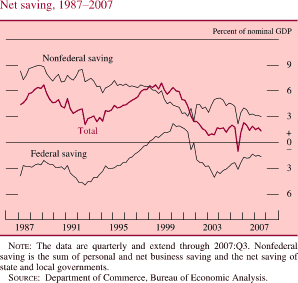
The data are quarterly and extend through 2007:Q3. Nonfederal saving is the sum of personal and net business saving and the net saving of state and local governments.
Source: Department of Commerce, Bureau of Economic Analysis.
Net national saving fell appreciably as a percentage of GDP between the late 1990s and the early part of this decade; that ratio has changed little since 2002 (apart from the third quarter of 2005, which was marked by sizable hurricane-related property losses). If not boosted over the longer run, persistent low levels of national saving will be associated with either slower capital formation or continued heavy borrowing from abroad, either of which would retard the rise in the standard of living of U.S. residents over time and hamper the ability of the nation to meet the retirement needs of an aging population.
The External Sector
International Trade
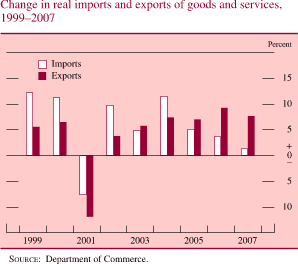
The external sector provided significant support to economic activity in the second half of last year. Net exports added almost 1 percentage point to U.S. GDP growth during that period, according to the latest GDP release from the Bureau of Economic Analysis, but data received since then suggest a somewhat larger positive contribution. The contribution of net exports was supported by a robust expansion--about 11 percent at an annual rate--of real exports of goods and services that was helped by still-solid growth of foreign economies and the effects of the past depreciation of the dollar. The broad-based rise in real exports of goods included sizable increases for automobiles, agricultural goods, and capital goods, especially aircraft. Exports of services rose in 2007 but at a slower pace than in the previous year. The value of exports to China, India, Russia, South America, and the members of OPEC rose quite substantially, and gains for exports to Canada and western Europe were also sizable. Exports to Mexico and Japan increased at a somewhat slower pace.
Change in Real Imports and Exports of Goods and Services, 1999-2007
Source: Department of Commerce
A slowdown in real imports was also a factor in the positive contribution of net exports to the growth of real GDP last year. The growth of real imports of goods and services decreased to about 1-1/2 percent in 2007, down from a 3-3/4 percent rise in 2006, in part because of a slowdown in U.S. domestic demand and the depreciation of the dollar. Although real imports of capital goods were strong, the growth of most other major categories declined. Despite the moderation in the growth of imports overall, the value of goods (excluding oil) imported from western Europe, China, and Mexico still rose at solid rates.
Given those movements in exports and imports, along with somewhat higher net investment income, the U.S. current account deficit appears likely to have shrunk in 2007 on an annual basis for the first time since 2001. The current account deficit narrowed from $811 billion in 2006 to an average of $753 billion at an annual rate, or around 5-1/2 percent of nominal GDP, in the first three quarters of 2007 (the latest available data). However, its largest component, the trade deficit, widened in the fourth quarter because of a steep increase in the price of imported oil.
U.S. Trade and Current Account Balances, 1999-2007
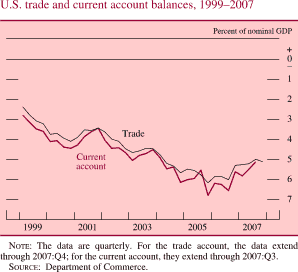
The data are quarterly. For the trade account, the data extend through 2007:Q4; for the current account, they extend through 2007:Q3.
Source: Department of Commerce.
The price of crude oil soared on world markets in 2007. The spot price of West Texas intermediate increased from around $60 per barrel at the end of 2006 to about $100 at present. The strong demand for oil was powered by the continued expansion of the world economy through 2007, especially in the developing countries. In addition, a number of actual and potential disruptions to supply have contributed to the surge in oil prices. OPEC members announced cuts to oil production in late 2006. Despite recent agreements that have reversed some of these cuts, OPEC production remains restrained. The growth of production has also been hampered by some governments' moves to take control of oil resources or raise their share of revenues. Geopolitical tensions in the Middle East and instability in Nigeria have contributed to concerns about oil supply as well. The price of the far-dated NYMEX oil futures contract (currently for delivery in 2016) now has risen to nearly $95 per barrel and likely reflects a belief by oil market participants that the balance of supply and demand will remain tight for some time to come.
Prices of Oil and of Nonfuel Commodities, 2003-08
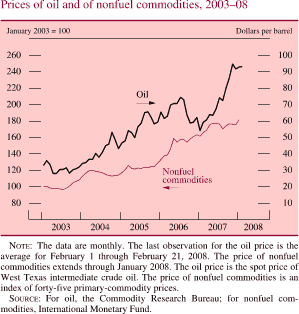
The data are monthly. The last observation for the oil price is the average for February 1 through February 21, 2008. The price of nonfuel commodities extends through January 2008. The oil price is the spot price of West Texas intermediate crude oil. The price of nonfuel commodities is an index of forty-five primary-commodity prices.
Source: For oil, the Commodity Research Bureau; for nonfuel commodities, International Monetary Fund.
Broad indexes of non-oil commodities prices remain elevated. Although they fell back slightly over the second half of last year, prices have again risen since the start of 2008. Prices of a number of metals, which surged in the spring on strong global demand, retreated somewhat during the latter half of 2007 as production increased and as users substituted into other materials. However, more recently the prices of copper and aluminum have moved back up. Prices for food commodities continue to rise steeply. Poor harvests in Australia as well as in parts of Europe and Asia led to higher wheat prices. The price of soybeans also has risen sharply because acreage has been shifted to corn production, in part to produce biofuel; in addition, the soybean harvest in China was down sharply from last year.
Import price inflation increased in 2007, with the depreciation of the dollar providing an important impetus; higher oil and food prices also contributed. Prices of imported goods rose about 8-1/2 percent in 2007, but excluding food, oil, and natural gas, such prices rose 2-1/4 percent; both rates were somewhat higher than in the previous year.
The Financial Account
Although the current account deficit appears to have narrowed during 2007, it remains sizable and continues to require a significant inflow of financing from abroad. As in the past, the deficit was largely financed by foreign net acquisitions of U.S. securities.
U.S. Net Financial Inflows, 2003-07
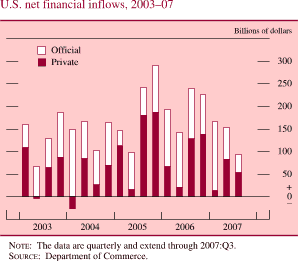
The data are quarterly and extend through 2007:Q3.
Source: Department of Commerce.
The global financial turmoil that began in the summer left an imprint on the components of the U.S. financial account. After acquiring record amounts of U.S. securities in the first half of 2007, foreign private investors sold a sizable net amount of non-Treasury U.S. securities in the third quarter--the first quarterly net sale of such securities in more than fifteen years. In contrast, foreign private demand for U.S. Treasury securities picked up sharply in the third quarter as global investors shifted into less-risky positions. On balance, flows out of non-Treasuries and into U.S. Treasuries nearly offset one another, and total foreign private acquisitions of U.S. securities recorded an unusually small net inflow for the third quarter. Preliminary data for the fourth quarter indicate renewed foreign acquisitions of U.S. corporate securities, although at a notably weaker pace than in the first half of the year. Foreign private demand for U.S. Treasury securities has remained strong.
Net Private Foreign Purchases of Long-Term U.S. Securities, 2003-07
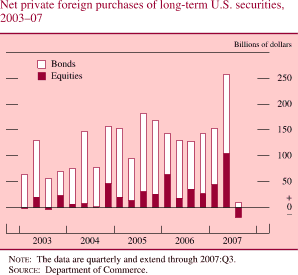
The data are quarterly and extend through 2007:Q3.
Source: Department of Commerce.
As issuers of asset-backed commercial paper around the globe began to encounter difficulties over the summer, nonbank entities that had issued commercial paper in the United States and lent the proceeds to foreign parents sharply curtailed those activities. As a result, those entities reduced their claims on foreign parents, and net financial inflows from nonbank entities thus were sizable in the third quarter. Foreign inflows through direct investment into the United States surged in the third quarter, as foreign parents injected additional equity capital into their U.S. affiliates.
Foreign official inflows slowed in the third quarter, as Asian central banks acquired debt securities issued by government-sponsored enterprises (GSEs) but on net sold U.S. Treasury securities. Official inflows appear to have strengthened again in the fourth quarter, with a return to moderate purchases of U.S. Treasury securities, continued strong purchases of GSE-issued debt securities, and a notable pickup in acquisitions of both corporate equities and corporate debt securities.
Net purchases of foreign securities by U.S. residents, which represent a financial outflow, were maintained at a brisk pace for 2007 as a whole. Outflows associated with U.S. direct investment abroad remained strong.
The Labor Market
Employment and Unemployment
The demand for labor decelerated early last year and has slowed further of late. The average monthly gain in private nonfarm payroll employment, which slid from about 160,000 in 2006 to 80,000 over the first ten months of 2007, was only 50,000 in November and December, and private employment was nearly flat in January 2008. The civilian unemployment rate, which had hovered around 4-1/2 percent in the early part of 2007, drifted up about 1/4 percentage point from May to November; it rose another 1/4 percentage point, on net, over the following two months and stood at 4.9 percent in January.
Net Change in Private Payroll Employment, 2001-08
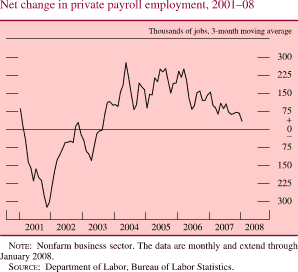
Nonfarm business sector. The data are monthly and extend through January 2008.
Source: Department of Labor, Bureau of Labor Statistics.
Civilian Unemployment Rate, 1974-2008
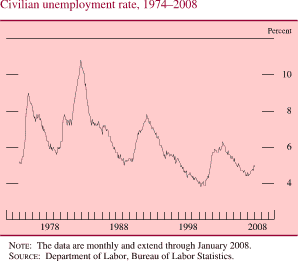
The data are monthly and extend through January 2008.
Source: Department of Labor, Bureau of Labor Statistics.
Employment in residential construction has been falling for about two years and now stands 375,000 below the high reached in early 2006. Jobs in related financial industries have also decreased lately. Payrolls in the manufacturing sector, which have been on a downtrend for more than a quarter-century, have continued to shrink. Meanwhile, some service-producing industries have maintained solid gains. In particular, hiring by health and education institutions and by food services and drinking establishments has remained strong, and job gains at businesses providing professional and technical services have been sizable as well.
The increase in joblessness since the spring of 2007 has been widespread across major demographic groups. In January 2008, unemployment rates for men and women aged 25 years and older were both about 1/4 percentage point above the levels of last spring, and--as typically occurs--rates for teenagers and young adults showed larger increases. Among the major racial and ethnic groups, unemployment rates for blacks and Hispanics rose somewhat more than did unemployment rates for whites, a differential also typical of periods when labor market conditions soften. An increase in the number of unemployed who had lost their last jobs (as opposed to those who had voluntarily left their jobs or were new entrants to the labor force) accounted for about half of the rise in the overall jobless rate between the spring of 2007 and January 2008. The labor force participation rate stood slightly above 66 percent in January; it has changed little, on net, over the past couple of years after falling appreciably over the first half of the decade.
Most other recent indicators also point to some softening of labor market conditions. Initial claims for unemployment insurance, which had remained relatively low through the fall, moved up somewhat in the closing months of 2007; though erratic from week to week, they appear to have risen further in early 2008. Meanwhile, private surveys suggest that firms have cut back on plans for hiring in the near term. Households have also become less upbeat about the prospects for the labor market in the year ahead.
Productivity and Labor Compensation
Output per hour in the nonfarm business sector rose 2-1/2 percent in 2007 after averaging just 1-1/2 percent per year over the preceding three years. Although estimates of the underlying pace of productivity growth are quite uncertain, the pickup in measured productivity growth in 2007 suggests that the fundamental forces supporting a solid underlying trend remain in place. Those forces include the rapid pace of technological change as well as the ongoing efforts by firms to use information technology to improve the efficiency of their operations. Increases in the amount of capital per worker also appear to be providing an impetus to productivity growth.
Hourly compensation rose at a relatively moderate rate in 2007 despite a pickup in overall consumer price inflation, a continued advance in labor productivity, and generally tight labor markets. The employment cost index (ECI) for private industry workers, which measures both wages and the cost of benefits, increased 3 percent in nominal terms over the twelve months of 2007, about in line with its pace in 2005 and 2006. Within the ECI, wages and salaries increased 3-1/4 percent in 2007, the same as in 2006 but 3/4 percentage point above the increases in 2004 and 2005. Meanwhile, increases in the cost of providing benefits have slowed markedly in recent years, in part because employer contributions for health insurance have decelerated. The increase in benefits costs in 2007, which amounted to just 2-1/2 percent, was also held down by a drop in employer contributions to defined-benefit retirement plans in the first quarter. The lower contributions appear to have been facilitated by several factors, including a high level of employer contributions over the preceding few years and the strong performance of the stock market in 2006.
Measures of Change in Hourly Compensation, 1997-2007
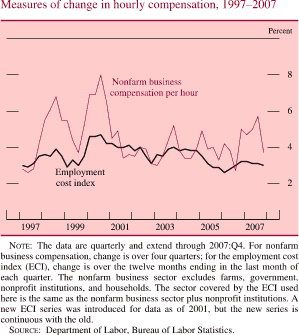
The data are quarterly and extend through 2007:Q4. For nonfarm business compensation, change is over four quarters; for the employment cost index (ECI), change is over the twelve months ending in the last month of each quarter. The nonfarm business sector excludes farms, government, nonprofit institutions, and households. The sector covered by the ECI used here is the same as the nonfarm business sector plus nonprofit institutions. A new ECI series was introduced for data as of 2001, but the new series is continuous with the old.
Source: Department of Labor, Bureau of Labor Statistics.
According to preliminary data, nominal compensation per hour in the nonfarm business sector--an alternative measure of hourly compensation derived from the compensation data in the NIPA--rose 3-3/4 percent in 2007, somewhat faster than the ECI. In 2006, the nonfarm business measure had risen 5 percent, with an apparent boost from a high level of bonuses and stock option exercises, which do not seem to have been repeated in 2007.9 The moderation in this measure last year, along with the step-up in measured productivity growth, held the increase in unit labor costs in 2007 to 1 percent. Unit labor costs rose about 2-1/2 percent per year, on average, from 2004 to 2006 after having been nearly flat over the preceding three years.
Change in Unit Labor Costs, 1996-2007
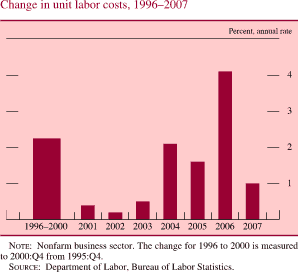
Nonfarm business sector. The change for 1996 to 2000 is measured to 2000:Q4 from 1995:Q4.
Source: Department of Labor, Bureau of Labor Statistics.
Prices
The PCE price index for energy rose nearly 20 percent over the four quarters of 2007 after having fallen modestly in 2006. The retail price of gasoline was up about 30 percent over the year as a whole, driven higher by the upsurge in the cost of crude oil. In 2008, gasoline prices through mid-February were around the high levels seen late last year. Prices of natural gas rose sharply in early 2007, but they receded over the second half of the year as inventories reached their highest levels since the early 1990s. So far in 2008, natural gas prices have risen notably as inventories have fallen back into line with seasonal norms. Consumer prices for electricity rose sharply last fall, likely because of last year's higher prices of fossil fuel inputs to electricity generation.
Last year's increase in the PCE price index for food and beverages, at 4-1/2 percent, was the largest in nearly two decades. Food prices accelerated in response to strong world demand and high demand for corn for the production of ethanol. Taken together, prices for meats, poultry, fish, and eggs rose 5-1/2 percent, and prices of dairy products were up at double-digit rates. Prices for purchased meals and beverages, which typically are influenced more by labor and other business costs than by farm prices, also recorded a sizable increase last year. In commodity markets, grain prices soared to near-record levels in late 2007 as strong global demand outstripped available supply, and they have moved somewhat higher since the turn of the year. Meanwhile, spot prices of livestock have declined of late; the decrease should provide some offset to the upward pressure from grain prices and thus help limit increases in consumer food prices in coming months.
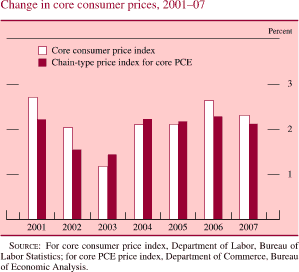
The pattern of core PCE inflation was uneven during 2007. In the first half of the year, core inflation was damped significantly by unusually soft prices for apparel, prescription drugs, and nonmarket items (especially financial services provided by banks without explicit charge); all of these developments proved transitory and were reversed later in the year with little net effect on core inflation over the year as a whole. Meanwhile, the rate of increase in the core CPI dropped from 2-3/4 percent in 2006 to 2-1/4 percent in 2007; the main reason for the sharper deceleration in the core CPI than in the core PCE price index is that housing costs, which rose less rapidly in 2007 than they had in 2006, carry much greater weight in the core CPI.
Change in Core Consumer Prices, 2001-07
Source: For core consumer price index, Department of Labor, Bureau of Labor Statistics; for core PCE price index, Department of Commerce, Bureau of Economic Analysis.
More fundamentally, the behavior of core inflation in 2007 was shaped by many of the same forces that were at work in 2006. The December jump in unemployment notwithstanding, resource utilization in labor and product markets remained fairly high last year, and increases in prices for energy and other industrial commodities continued to add to the cost of producing a wide variety of goods and services. Higher prices for non-oil imports also likely put some upward pressure on core inflation. Meanwhile, the news on inflation expectations has been mixed. Probably reflecting the higher rate of actual headline inflation, the median expectation for year-ahead inflation in the Reuters/University of Michigan Surveys of Consumers moved up from 3 percent in early 2007 to between 3-1/4 percent and 3-1/2 percent last spring; apart from a downward blip in the autumn, it remained there through January 2008 and spurted to 3-3/4 percent in the preliminary estimate for February. In contrast, most indicators suggest that expectations for longer-run inflation have remained reasonably well contained. The preliminary February result for median five- to ten-year inflation expectations in the Reuters/University of Michigan survey, at 3.0 percent, was around the middle of the narrow range that has prevailed for the past few years. And according to the Survey of Professional Forecasters, conducted by the Federal Reserve Bank of Philadelphia, expectations of CPI inflation over the next ten years have remained around 2-1/2 percent, a level that has been essentially unchanged since 1998. Meanwhile, ten-year inflation compensation, as measured by the spreads of yields on nominal Treasury securities over those on their inflation-protected counterparts, has changed little, on balance, since mid-2007.
Last year's sharp rise in energy prices also left an imprint on the price index for GDP, which rose a little more than 2-1/2 percent for the second year in a row.10 Excluding food and energy prices, the increase in GDP prices slowed from 3 percent in 2006 to 2-1/4 percent in 2007; significantly smaller increases in construction prices accounted for much of the deceleration.
Note: Changes are based on quarterly averages of seasonally adjusted data.
Source: For chain-type measures, Department of Commerce, Bureau of Economic Analysis; for fixed-weight measures, Department of Labor, Bureau of Labor Statistics.
Financial Developments
Financial Markets
Market Functioning and Financial Stability
The ongoing erosion in the credit quality of subprime residential mortgages, particularly adjustable-rate mortgages, has exposed weaknesses in other financial markets and posed challenges to financial institutions. Over the first half of 2007, problems were mostly isolated within the subprime mortgage markets. However, around midyear, as credit quality in that sector continued to worsen and losses mounted, investors began to retreat from structured credit products and from risky assets more generally. Strains began to emerge in the leveraged syndicated loan market in late June and then surfaced in the asset-backed commercial paper and term bank funding markets in August. After a respite in late September and October, revelations of larger-than-expected losses at several financial firms and a weaker economic outlook contributed to year-end pressures in short-term funding markets that exacerbated financial strains and heightened market volatility. Financial markets remained volatile through mid-February, in part owing to a further downgrading of the economic outlook and problems at some financial guarantors.
Signs of investor nervousness about the mortgage situation first appeared in December 2006 and then intensified in late February 2007, at a time when softer-than-expected U.S. economic data were adding to market uncertainty. Over this period, mortgage companies specializing in subprime products began to experience considerable funding pressures, and many failed, because rising delinquencies on recently originated subprime mortgages required those firms to repurchase the bad loans from securitized pools. Financial markets calmed in April, however, and liquidity in major markets remained ample. In June, rating agencies downgraded or put under review for possible downgrade the credit ratings of a large number of securities backed by subprime mortgages. Shortly thereafter, a few hedge funds experienced serious difficulties as a result of subprime-related investments.
Prices of indexes of credit default swaps on residential mortgage-backed securities backed by subprime mortgages--which had already weakened over the first half of 2007 for the lower-rated tranches--dropped steeply in July for both lower-rated and higher-rated tranches. Subsequently, investor demand for securities backed by subprime and alt-A mortgage pools dwindled, and the securitization market for those products virtually shut down. Those developments amplified credit and funding pressures on mortgage companies specializing in subprime mortgages; with no buyers for the mortgages they originated, more of those firms were forced to close or drastically reduce their operations, and subprime originations slowed to a crawl. Originations of alt-A mortgages--which had held up over the first half of the year--also dropped sharply beginning in July. Interest rates on jumbo loans increased, but institutions that had the capacity to hold such loans on their balance sheets continued to make them available to prime borrowers. In contrast, the market for conforming mortgages for prime borrowers was affected relatively little. Indeed, the issuance of securities carrying guarantees from Fannie Mae or Freddie Mac rose somewhat in the second half of the year.
Prices of Indexes of Credit Default Swaps on Subprime Mortgages, 2007-08
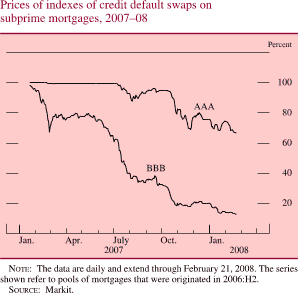
The data are daily and extend through February 21, 2008. The series shown refer to pools of mortgages that were originated in 2006:H2.
Source: Markit.
Gross Issuance of Securities Backed by Alt-A and Subprime Mortgage Pools, 2002-08
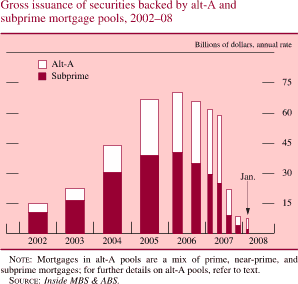
Mortgages in alt-A pools are a mix of prime, near-prime, and subprime mortgages; for further details on alt-A pools, refer to text.
Source: Inside MBS & ABS.
The unprecedented decline in the value of highly rated tranches of mortgage-related securities led investors to doubt their own ability, and that of the rating agencies, to evaluate many other types of structured instruments. The loss of confidence was reflected in significantly higher spreads on the debt of collateralized loan obligations (CLOs), and the issuance of such debt weakened noticeably over the summer. Because CLOs had been the largest purchasers of leveraged syndicated loans, the drop in issuance contributed to the decline in leveraged lending. In the secondary market for such loans, trading volumes were reportedly large, but bid-asked spreads widened sharply and prices, which had been high in the first half of 2007, declined markedly. Implied spreads on an index of loan-only credit default swaps (LCDX) spiked in July and remained elevated in August. Unable to distribute many leveraged syndicated loans that they had reportedly underwritten--a problem apparently affecting about $250 billion of such loans in the United States alone--banks faced the prospect of bringing those loans onto their balance sheets as the underlying deals closed.
LCDX Indexes, 2007-08
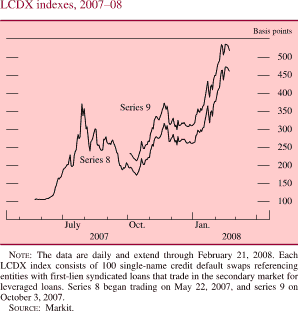
The data are daily and extend through February 21, 2008. Each LCDX index consists of 100 single-name credit default swaps referencing entities with first-lien syndicated loans that trade in the secondary market for leveraged loans. Series 8 began trading on May 22, 2007, and series 9 on October 3, 2007.
Source: Markit.
At the end of July, European asset-backed commercial paper (ABCP) and short-term funding markets were roiled by warnings of heavy losses associated with commercial paper programs backed by U.S. subprime mortgages. On August 9, a major European bank announced that it had frozen redemptions for three of its investment funds, citing its inability to value some of the mortgage-related securities held by the funds. After that announcement, liquidity problems and short-term funding pressures intensified in Europe and emerged in U.S. money markets. Partly in response to those developments, the Federal Reserve and other central banks took steps to foster smoother functioning of short-term credit markets (refer to the box entitled "The Federal Reserve's Responses to Financial Strains").
Spreads on U.S. ABCP widened considerably in mid-August, and the volume of ABCP outstanding began a precipitous decline as investors balked at rolling over paper for more than a few days. Outstanding European ABCP also declined substantially, and the market for Canadian ABCP not sponsored by banks virtually collapsed.11 Structured investment vehicles (SIVs) and single-seller ABCP conduits that were heavily exposed to securities backed by subprime mortgages experienced the greatest difficulties. Unlike traditional ABCP programs, SIVs had very little explicit liquidity support from their sponsors. As a result, investors became particularly concerned about the ability of SIVs--even those with little or no exposure to residential mortgages--to make timely payments, and demand for ABCP issued by SIVs fell sharply. Over the next few weeks, some U.S. issuers invoked their right to extend the maturity of their paper. Others temporarily drew on their bank-provided backup credit lines, and a few issuers defaulted. The general uncertainty and lack of liquidity also led to some decrease in demand for lower-tier unsecured nonfinancial commercial paper--especially at longer maturities--and spreads in that segment of the market widened markedly in August as well. Issuers of high-grade unsecured commercial paper were largely unaffected by the turmoil and experienced little disruption.
Commercial Paper, 2005-08
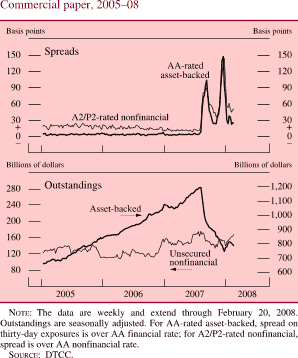
The data are weekly and extend through February 20, 2008. Outstandings are seasonally adjusted. For AA-rated asset-backed, spread on thirty-day exposures is over AA financial rate; for A2/P2-rated nonfinancial, spread is over AA nonfinancial rate.
Source: DTCC.
At the same time, term interbank funding markets in the United States and Europe came under pressure. Banks recognized that the difficulties in the markets for mortgages, syndicated loans, and commercial paper could lead to substantially larger-than-anticipated calls on their funding capacity. Moreover, creditors found they could not reliably determine the size of their counterparties' potential exposures to those markets, and concerns about valuation practices added to the overall uncertainty. As a result, banks became much less willing to provide funding to others, including other banks, especially for terms of more than a few days. Spreads of term federal funds rates and term Libor over rates on comparable-maturity overnight index swaps widened appreciably, and the liquidity in these markets diminished (for the definition of overnight index swaps, refer to the accompanying figure). European banks also sought to secure term funding in their domestic currencies, and similar spreads were seen in term euro and sterling Libor markets. Liquidity in the foreign exchange swap market was poor over this period, and European firms found it more difficult and costly to use the foreign exchange swap market to swap term funds denominated in euros or other currencies for funds denominated in dollars. Term funding markets in the Japanese yen and Australian dollar also came under pressure as foreign institutions attempted to borrow in those currencies and swap the funds into dollars or euros.
One-Month Libor Minus OIS Rate, 2007-08
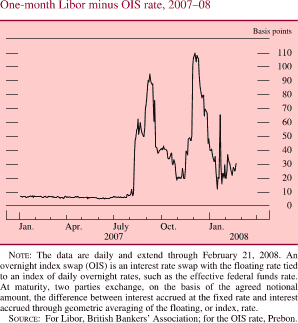
The data are daily and extend through February 21, 2008. An overnight index swap (OIS) is an interest rate swap with the floating rate tied to an index of daily overnight rates, such as the effective federal funds rate. At maturity, two parties exchange, on the basis of the agreed notional amount, the difference between interest accrued at the fixed rate and interest accrued through geometric averaging of the floating, or index, rate.
Source: For Libor, British Bankers' Association; for the OIS rate, Prebon.
Against that backdrop, investors fled to the relative safety of Treasury securities, particularly Treasury bills, during mid-August. For example, inflows into money market mutual funds investing only in Treasury and agency securities jumped in August. Surges of safe-haven demand caused Treasury bill rates to plunge at times, and the considerable volatility in that market was likely exacerbated in September by a seasonal reduction in bill supply. Bid-asked spreads in the Treasury bill market widened substantially in this period.
The Federal Reserve's Responses to Financial Strains
In response to the serious financial strains that emerged last August, the Federal Reserve has undertaken a number of measures to foster the normal functioning of financial markets and thereby promote its dual objectives of maximum employment and price stability.
In mid-August, the Federal Reserve, as well as several foreign central banks, took actions designed to provide liquidity and help stabilize markets. On August 9, the European Central Bank (ECB) conducted an unscheduled tender operation in response to sharply elevated demands for liquidity by European banks, an action it repeated several more times in subsequent weeks. On August 10, similar stresses emerged in U.S. money markets, and the Federal Reserve added substantial reserves to meet heightened demand for funds from banks.
Short-term markets remained under considerable pressure over subsequent days despite the provision of ample liquidity in overnight funding markets by the Federal Reserve, the ECB, and the central banks of other major industrialized countries. On August 17, the Federal Reserve Board announced a narrowing of the spread between the federal funds rate and the discount rate from 100 basis points to 50 basis points and changed discount window lending practices to allow the provision of term financing for as long as thirty days, renewable by the borrower. To ease pressures in the Treasury market, the Federal Reserve Bank of New York announced on August 21 some temporary changes to the terms and conditions of the System Open Market Account (SOMA) securities lending program.
The Federal Reserve's efforts achieved some of the desired results. The provision of increased liquidity generally succeeded in keeping the federal funds rate from rising above its intended level. (Indeed, despite heightened demand for liquidity, the effective federal funds rate was somewhat below the target for a time in August and early September, as efforts to keep the rate near the target were hampered by technical factors and financial market volatility.) After the September meeting of the Federal Open Market Committee, conditions in overnight funding markets improved further. The volume of loans to depository institutions made through the discount window increased at times because of term loans to a relatively small number of institutions, but it remained generally moderate. Institutions may have been reluctant to use the discount window, perhaps fearing that their borrowing would become known and would be seen by creditors and counterparties as a sign of financial weakness--the so-called stigma problem. Nonetheless, collateral placed by banks at the discount window in anticipation of possible borrowing rose sharply during August and September, which suggested that some banks viewed the discount window as a potentially valuable option.
Pressures in financial markets ebbed for a time in the fall but rose again later in the year. On November 26, the Federal Reserve Bank of New York announced some additional modest, temporary changes to the SOMA securities lending program that were designed to further relax the limitations on borrowing particular Treasury securities and to improve the functioning of the Treasury market. In addition, the New York Reserve Bank stated that the Open Market Trading Desk planned to conduct a series of term repurchase agreements that would extend over year-end and that it would provide sufficient reserves to resist upward pressures on the federal funds rate around year-end. Then on December 12, the Federal Reserve and several foreign central banks announced a coordinated effort to facilitate a return to more-normal pricing and functioning in term funding markets. As part of that effort, the Federal Reserve announced the creation of a temporary Term Auction Facility (TAF) to provide secured term funding to eligible depository institutions through an auction mechanism beginning in mid-December. The Federal Reserve also established swap lines with the ECB and the Swiss National Bank (SNB), which provided dollar funds that those central banks could lend in their jurisdictions. At the same time, the Bank of England and the Bank of Canada announced plans to conduct similar term funding operations in their own currencies.
The Federal Reserve has conducted six TAF auctions thus far, two of $20 billion in December, two of $30 billion in January, and two of $30 billion in February. The auctions attracted a large number of bidders. The ratio of the dollar value of bids to the amount offered (the bid-to-cover ratio) at the two auctions in December was about 3. The auctions in January and February were somewhat less oversubscribed, with bid-to-cover ratios of roughly 2 on January 14, February 11, and February 25 and of 1-1/4 on January 28. The lower bid-to-cover ratios in those auctions may have reflected improved liquidity in term funding markets, the larger auction size, and, for the January 28 auction, some uncertainty about the monetary policy action that would be taken at the January 29-30 FOMC meeting.
The spread of the interest rate for the auctioned funds over the minimum bid rate (the overnight-index-swap rate corresponding to the maturity of the credit being auctioned) was about 50 basis points in December but was lower in the January and February auctions. The lower spread apparently reflected some improvement in banks' access to term funding after the turn of the year. Although isolating the impact of the TAF on financial markets is not easy, a decline in spreads in term funding markets since early December provides some evidence that the TAF may have had beneficial effects on financial markets. The initial experience with the TAF suggests that it may well be a useful complement to the discount window in some circumstances, and the Federal Reserve Board will consider making it a permanent addition to the Federal Reserve's available instruments for providing liquidity to the banking system.
The swap arrangements with foreign central banks allowed for up to $20 billion in currency swaps with the ECB and up to $4 billion with the SNB. Drawing upon these lines, the ECB auctioned $10 billion in dollar funds on December 17 and another $10 billion on December 20 in coordination with the Federal Reserve's TAF auctions. The SNB auctioned $4 billion in funds on December 17. The bid-to-cover ratios at the ECB and SNB auctions in December ranged between 1-1/4 and 4-1/4; the actions were considered successful in helping to give foreign financial institutions access to additional dollar funding. The December loans were renewed by the ECB and SNB at auctions in January, with bid-to-cover ratios ranging from 1-1/4 to 2-3/4. The ECB and SNB have not conducted auctions in February; ECB officials have indicated that consideration would be given to reactivating dollar auctions if conditions appear to warrant such actions.
Financial conditions appeared to improve somewhat in late September and October after the larger-than-expected reduction of 50 basis points in the federal funds rate at the September FOMC meeting and a few encouraging reports on economic activity. Spreads in many short-term funding markets partially reversed their August run-ups. Bid-asked spreads in the interdealer market for Treasury bills were a bit less elevated than they had been in August. But the Treasury bill market remained thin, and yields were volatile at times. In the syndicated loan market, implied LCDX spreads partly reversed their summer surge, and some multibillion-dollar deals were successfully placed in the market. However, underwriting banks were forced to take sizable discounts from par value to induce investors to purchase the loans, and they retained significantly larger-than-intended portions of deals on their own balance sheets. The improvements in market functioning proved to be short lived, in part because of a further worsening in the outlook for the housing sector and associated concerns about possible effects on financial institutions and the economy.
The strains in financial markets intensified during November and December. The syndicated loan market again ground to a halt, and spreads on the LCDX indexes moved up. The heightened uncertainties and ongoing financial turmoil, along with the desire of financial institutions to show safe and liquid assets on their year-end statements, generated significant year-end pressures in short-term funding markets for the first time in several years. Spreads on one-month Libor and term federal funds shot up in late November when their maturities crossed year-end. Similarly, spreads on ABCP and lower-tier unsecured commercial paper widened further over the period. Strong demand for safe assets over year-end drove yields on short-dated Treasury bills maturing in early 2008 to low levels, and liquidity in that market was impaired at times.
In mid-December, the Federal Reserve announced coordinated action with a number of other central banks to help facilitate a return to more-normal pricing and functioning in term funding markets. The efforts of the central banks, combined with the passage of year-end, appeared to help steady short-term financial markets in early 2008. So far this year, commercial paper spreads--both for ABCP and for lower-tier unsecured paper--and term bank funding spreads have dropped, although they remain above the levels that prevailed before last August. In contrast, liquidity in the Treasury bill market has been inconsistent. The subprime and alt-A mortgage markets remain essentially shuttered. Conditions in the market for leveraged syndicated loans have worsened, and the forward calendar of committed deals remains substantial. Risk spreads on corporate bonds widened significantly in January, and equity prices dropped. Most recently, demand has evaporated for auction-rate securities--long-term debt (much of which is municipal bonds) with floating interest rates that are reset at frequent, regular auctions--and thereby imposed higher rates on issuers and reduced liquidity for current holders.
In January and February, problems at several financial guarantors intensified as rating agencies and investors became more concerned that guarantors' exposures to collateralized debt obligations that hold asset-backed securities (especially those backed by subprime residential mortgages) had imperiled the guarantors' AAA ratings. Indeed, the rating agencies downgraded a few financial guarantors and put some firms on watch for possible downgrades; financial guarantors' equity prices declined, and credit default swap spreads increased. A number of guarantors are undertaking efforts to bolster their financial strength.
Financial guarantors have played an important role in the markets for municipal bonds and for some structured finance products by providing insurance against default. Those markets have already felt some effects from the stress at the financial guarantors and could be more substantially affected by any future downgrades. The direct exposures of U.S. banks to losses from downgrades of guarantors' ratings--through banks' holdings of municipal bonds and credit protection on structured products--appear to be moderate relative to the banks' capital. But some large banks and broker-dealers could experience significant funding pressures from structured products tied to municipal bonds that might return to their balance sheets if guarantors are downgraded below specified thresholds or if investors choose to unwind their investments in advance of potential downgrades.
Although U.S. financial markets and institutions have encountered considerable difficulties over the past several months, the financial system entered that period with some distinct strengths. In particular, most large financial institutions had strong capital positions, and the financial infrastructure was robust. Although some large financial institutions have experienced sizable losses, the sector generally remains healthy. A number of the firms that have reported sizable write-downs of assets have been able to raise additional capital. Market infrastructure for clearing and settlement performed well over the year, even when volatility spiked and trading volumes were very large.
Moreover, not all markets experienced significant impairment. For instance, the investment-grade corporate bond market reportedly functioned well over most of the period, and the unsecured high-grade commercial paper market appeared little affected by the difficulties encountered in other short-term funding markets. The securitization of consumer loans and conforming residential mortgages was robust. Despite a few notable failures, hedge funds overall seemed to hold up fairly well, and counterparties of failing hedge funds did not sustain material losses.
Policy Expectations and Interest Rates
The current target for the federal funds rate, 3 percent, is substantially below the level that investors expected at the end of June 2007. Judging from futures quotes at that time, market participants expected the FOMC to shave at most 25 basis points from the federal funds rate by February 2008 rather than the 225 basis points that has been realized. Investors currently expect about 100 basis points of additional easing by the end of 2008. Uncertainty about the path of policy had been very low during the first half of the year, but it increased appreciably over the summer and generally has remained around its long-run historical average since then.
Although nominal Treasury yields rose somewhat over the first half of last year, rates subsequently fell sharply as the outlook for the economy dimmed and as market participants revised their expectations for monetary policy accordingly. Treasury bill yields declined to particularly low levels at times because of increased demand for safe and liquid assets. On net, two-year yields fell roughly 180 basis points in the second half of the year, and ten-year yields shed about 100 basis points. Treasury yields fell significantly more in early 2008, especially for shorter-term securities, as policy expectations shifted down in response to signs of further weakness in the economic outlook. As of February 21, the two-year yield was about 2 percent, and the ten-year yield was about 3-3/4 percent.
Interest Rates on Selected Treasury Securities, 2003-08
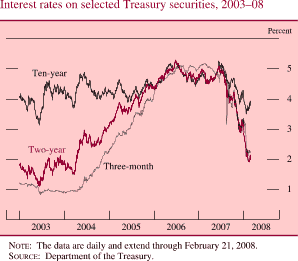
The data are daily and extend through February 21, 2008.
Source: Department of the Treasury.
Yields on inflation-indexed Treasury securities also declined considerably in the second half of 2007 and into 2008. The difference between the five-year nominal Treasury yield and the five-year inflation-indexed Treasury yield--five-year inflation compensation--edged down over that period. Meanwhile, the ten-year inflation compensation measure changed little. As noted earlier, survey-based measures of short-term inflation expectations rose somewhat in 2007 and early 2008, presumably because of the increase in headline inflation. Survey measures of longer-term inflation expectations changed only slightly.
TIPS-Based Inflation Compensation, 2003-08
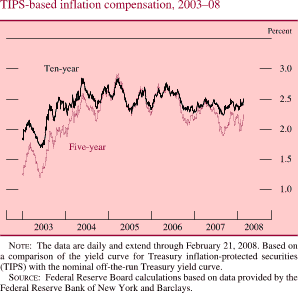
The data are daily and extend through February 21, 2008. Based on a comparison of the yield curve for Treasury inflation-protected securities (TIPS) with the nominal off-the-run Treasury yield curve.
Source: Federal Reserve Board calculations based on data provided by the Federal Reserve Bank of New York and Barclays.
Yields on corporate bonds firmed a bit over the first half of 2007, and spreads of those yields over yields on comparable-maturity Treasury securities changed little, on net. Since June, yields on AA-rated corporate bonds have decreased somewhat, on net, while those on BBB-rated bonds increased slightly; spreads on AA-rated and BBB-rated bonds have risen about 90 and 130 basis points respectively. Moreover, yields on speculative-grade securities have increased substantially over the same period, and their spreads have shot up almost 300 basis points.
Equity Markets
Broad equity indexes logged increases of around 10 percent over the first half of 2007 but then lost ground over the second half; they ended the year with gains of 3 percent to 6 percent. The increase reflected continued strong profitability in many nonfinancial sectors, particularly energy, basic materials, and technology. By contrast, stock indexes for the financial sector fell about 20 percent in 2007 as investors reacted to the fallout from the problems in the subprime mortgage sector. So far in 2008, growing concerns about the economic outlook, along with announcements of additional substantial losses at some large financial firms, have precipitated a widespread drop in equity prices that has pushed broad indexes down about 8 percent.
Stock Price Indexes, 2005-08
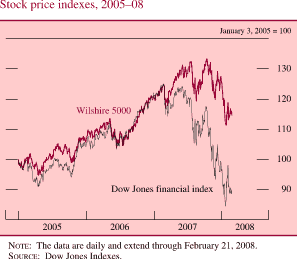
The data are daily and extend through February 21, 2008.
Source: Dow Jones Indexes.
The continued uncertainty surrounding the ultimate size and distribution of losses from subprime-related and other investment products, as well as the potential effects of the financial turmoil on the broader economy, contributed to higher volatility in equity markets and a wider equity premium. The implied volatility of the S&P 500, as calculated from options prices, rose significantly in the second half of 2007 and remains elevated. The ratio of twelve-month-forward expected earnings to equity prices for S&P 500 firms increased over the second half of 2007 and into 2008, while the long-term real Treasury yield decreased. The difference between these two values--a measure of the premium that investors require for holding equity shares--has reached the high end of its range over the past twenty years.
Implied S&P Volatility, 2000-08
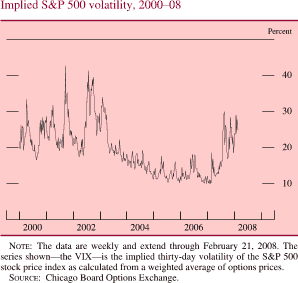
The data are weekly and extend through February 21, 2008. The series shown--the VIX--is the implied thirty-day volatility of the S&P 500 stock price index as calculated from a weighted average of options prices.
Source: Chicago Board Options Exchange.
Flows into equity mutual funds were heavy early in 2007 but slowed substantially after the first quarter. Indeed, equity funds that focused on domestic holdings experienced consistent net outflows beginning in the spring. By contrast, inflows into foreign equity funds held up through the end of 2007 despite the weakness in many foreign stock markets in the fourth quarter. Both domestic and foreign equity funds experienced large outflows in January as equity prices tumbled worldwide, but flows appear to have stabilized in February.
Debt and Financial Intermediation
The total debt of the domestic nonfinancial sectors appears to have expanded about 8 percent in 2007, a slightly slower rate of growth than in 2006. The slowing reflected a deceleration of household debt that was only partially offset by a considerable step-up in borrowing by businesses and governments.
Change in Total Domestic Nonfinancial Debt, 1991-2007
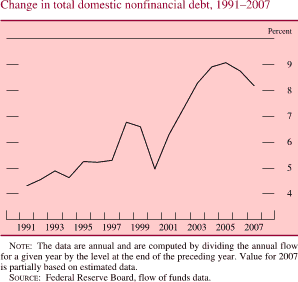
The data are annual and are computed by dividing the annual flow for a given year by the level at the end of the preceding year. Value for 2007 is partially based on estimated data.
Source: Federal Reserve Board, flow of funds data.
Commercial bank credit rose 10-1/4 percent last year, a pickup from the 9-3/4 percent gain in 2006.12 The acceleration of bank credit, as well as the differences in growth rates across bank asset classes, reflect in part the effects of the financial market distress. As already noted, commercial and industrial loans surged in 2007 because of extremely rapid growth in the second half of the year that in part resulted from the inability of banks to syndicate leveraged loans. At various times over the second half of the year, banks' balance sheets were boosted by extensions of credit to nonbank financial institutions, a category that includes loans to ABCP programs that were no longer able to issue commercial paper. Through the third quarter of 2007, the growth of residential mortgages (excluding revolving home equity loans) was fairly robust, but the value of such loans on banks' books contracted in the fourth quarter. The reversal likely stemmed from a stepped-up pace of securitization of conforming mortgages and a slowing of new originations in response to the weaker demand and the tightening of lending standards reported in the Senior Loan Officer Opinion Surveys covering the second half of 2007. The growth of revolving home equity loans picked up in 2007, particularly late in the year; because rates on such loans are generally tied to short-term market rates, which declined over the second half of 2007, that form of financing may have become relatively more attractive. Bank consumer loans grew somewhat faster in 2007 than in 2006, which is consistent with some substitution of nonmortgage credit for mortgage credit. To fund the rapid expansion of their balance sheets, commercial banks mainly turned to a variety of managed liabilities, including large time deposits and advances from Federal Home Loan Banks. Branches and agencies of foreign banks also tapped their parent institutions for funds. The growth of bank credit slowed in January 2008, as declines in holdings of securities and residential mortgages partly offset continued growth in most other loan categories.
Bank profits declined significantly in 2007 as fallout from the subprime mortgage crisis and related financial disruptions caused trading income to plunge and loss provisions to more than double from the previous year. Over the second half of 2007, the return on assets and the return on equity both dropped to levels not seen since the early 1990s. Weak profits or outright losses, along with significant balance sheet growth, also put pressure on capital ratios at some of the largest commercial banks. In response, a number of banking organizations raised significant amounts of new capital in the second half of 2007 and early 2008. Loan delinquency rates rose noticeably for many loan categories, but especially for residential mortgages, construction and land development loans financing residential projects, and other construction and land development loans.
Commercial Bank Profitability, 1988-2007
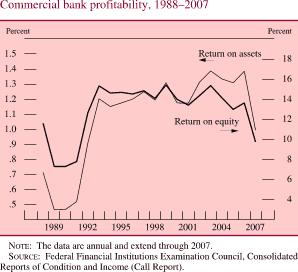
The data are annual and extend through 2007.
Source: Federal Financial Institutions Examination Council, Consolidated Reports of Condition and Income (Call Report).
Other types of financial institutions also faced substantial challenges in 2007. As a result of exposures to subprime loans, some thrift institutions had significant losses. Several of the major investment banks and their affiliates booked losses on mortgage-related products and other exposures that were large enough to lead some of them to raise additional equity capital.
In the third quarter, Fannie Mae and Freddie Mac each experienced sizable losses on their mortgage portfolios and on credit guarantees. In response, both firms raised additional equity. The firms also tightened underwriting standards slightly and increased the fees that they charge to purchase some types of loans. All else equal, these changes would be expected to increase borrower costs for conforming loans.
The M2 Monetary Aggregate
M2 grew at a solid rate, on balance, in 2007 and the early part of 2008. Growth was supported by declines in the opportunity cost of holding money relative to other financial assets. The considerable growth of money market mutual funds also boosted M2 as investors sought the relative safety of these liquid assets amid the volatility in various financial markets. The currency component of M2 decelerated further in 2007 from its already tepid pace in 2006; it actually contracted from November through January 2008, probably because of reduced demand from foreign sources.
M2 Growth Rate, 1991-2007
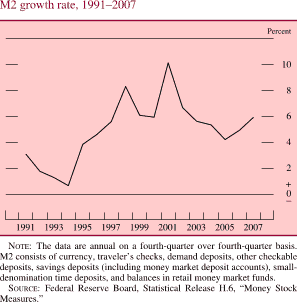
The data are annual on a fourth-quarter over fourth-quarter basis. M2 consists of currency, traveler's checks, demand deposits, other checkable deposits, savings deposits (including money market deposit accounts), small-denomination time deposits, and balances in retail money market funds.
Source: Federal Reserve Board, Statistical Release H.6, "Money Stock Measures."
International Developments
International Developments
Equity Indexes in Selected Advanced Foreign Economies, 2006-08
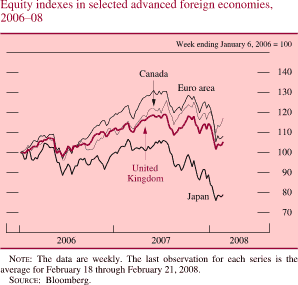
The data are weekly. The last observation for each series is the average for February 18 through February 21, 2008.
Source: Bloomberg.
Equity Indexes in Selected Emerging-Market Economies, 2006-08
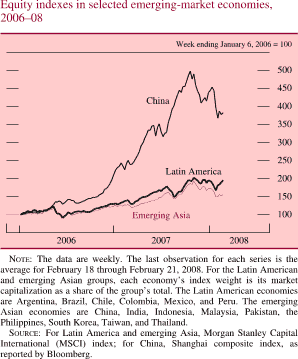
The data are weekly. The last observation for each series is the average for February 18 through February 21, 2008. For the Latin American and emerging Asian groups, each economy's index weight is its market capitalization as a share of the group's total. The Latin American economies are Argentina, Brazil, Chile, Colombia, Mexico, and Peru. The emerging Asian economies are China, India, Indonesia, Malaysia, Pakistan, the Philippines, South Korea, Taiwan, and Thailand.
Source: For Latin America and emerging Asia, Morgan Stanley Capital International (MSCI) index; for China, Shanghai composite index, as reported by Bloomberg.
Long-term bond yields in the advanced foreign economies rose over the first half of 2007 but then reversed course as investors reacted to signs in many countries of deteriorating financial conditions, a softening economic outlook, and expectations for a lower future path of monetary policy rates. All told, the net changes were not large; long-term rates in Canada, the United Kingdom, and Japan ended the year 20 to 30 basis points lower, on net, while they were about 10 basis points higher in the euro area than at the start of the year. Yields on inflation-protected long-term securities followed a similar pattern; inflation compensation (the difference between yields on nominal securities and those on inflation-protected securities) fell modestly in Canada and rose slightly in the euro area. Since the beginning of 2008, yields on nominal securities in most economies have declined; yields on indexed securities have fallen in the euro area but have risen in Canada, the United Kingdom, and Japan.
Yields on Benchmark Government Bonds in Selected Advanced Foreign Economies, 2004-08
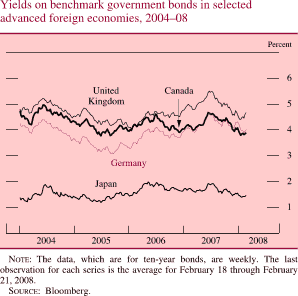
The data, which are for ten-year bonds, are weekly. The last observation for each series is the average for February 18 through February 21, 2008.
Source: Bloomberg.
The Federal Reserve's broadest measure of the nominal trade-weighted foreign exchange value of the dollar has declined about 8 percent on net since the beginning of 2007. Over the same period, the major currencies index of the dollar has moved down a bit more than 10 percent. The dollar has depreciated about 9-1/2 percent against the yen and slightly more than 10 percent versus the euro. The dollar has depreciated roughly 13-1/2 percent against the Canadian dollar and in November briefly touched its lowest level in decades against that currency. The dollar has declined 8-1/2 percent against the Chinese renminbi since the beginning of 2007, and the pace of depreciation accelerated late last year.
U.S. Dollar Nominal Exchange Rate, Broad Index, 2004-08
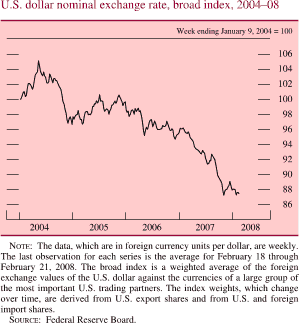
The data, which are in foreign currency units per dollar, are weekly. The last observation for each series is the average for February 18 through February 21, 2008. The broad index is a weighted average of the foreign exchange values of the U.S. dollar against the currencies of a large group of the most important U.S. trading partners. The index weights, which change over time, are derived from U.S. export shares and from U.S. and foreign import shares.
Source: Federal Reserve Board.
U.S. Dollar Exchange Rate Against Selected Major Currencies, 2004-08
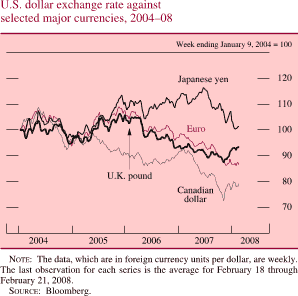
The data, which are in foreign currency units per dollar, are weekly. The last observation for each series is the average for February 18 through February 21, 2008.
Source: Bloomberg.
Advanced Foreign Economies
Economic activity in the major advanced foreign economies posted relatively strong growth over the first three quarters of 2007, and labor markets tightened. However, evidence of a slowdown has accumulated since the summer. Financial market strains appear to be weighing on growth in the major economies. Surveys of banks have revealed a tightening of credit standards for both households and businesses. Both consumer and business confidence have slid since August, and readings from surveys of economic activity have declined. Retail sales have slowed, and housing markets in a number of countries that until recently had been robust--including Ireland, Spain, and the United Kingdom--have softened. According to initial releases, real GDP growth for the fourth quarter slowed in a number of countries. Although growth in Japan rebounded in the fourth quarter--pushed up by strong exports and capital spending--household spending has been relatively weak, and the construction sector has been depressed by changes to regulations that have resulted in bottlenecks in reviewing building plans.
Headline rates of inflation have continued to rise in some economies, mainly because of increasing food and energy prices. The twelve-month change in consumer prices in the euro area exceeded 3 percent in January, up from less than 2 percent just a few months earlier; core inflation (which excludes the changes in the prices of energy and unprocessed food) has moved up as well. Canadian inflation climbed from less than 1 percent late in 2006 to about 2-1/2 percent in the second half of 2007; however, core inflation has slowed in recent months, partly because of the continued strength of the Canadian dollar. Although inflation in Japan was close to zero for most of 2007, the rate picked up to roughly 3/4 percent at the end of the year, again mainly a result of the rise in energy prices.
Consumer Prices for Major Foreign Economies, 2004-08
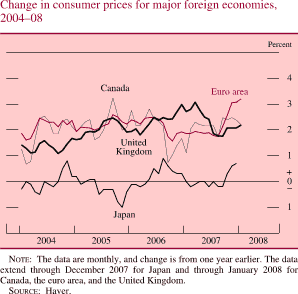
The data are monthly, and change is from one year earlier. The data extend through December 2007 for Japan and through January 2008 for Canada, the euro area, and the United Kingdom.
Source: Haver.
Official or Targeted Interest Rates in Selected Advanced Foreign Economies, 2004-08
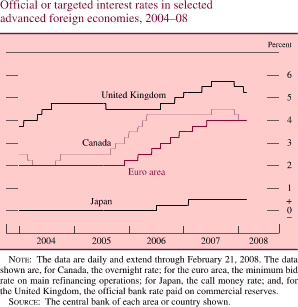
The data are daily and extend through February 21, 2008. The data shown are, for Canada, the overnight rate; for the euro area, the minimum bid rate on main refinancing operations; for Japan, the call money rate; and, for the United Kingdom, the official bank rate paid on commercial reserves.
Source: The central bank of each area or country shown.
Faced with a weaker outlook for growth but somewhat higher inflation, major foreign central banks either have cut official policy rates or have remained on hold since late 2007--a change from earlier market expectations of further rate increases. The Bank of Canada and the Bank of England lowered their targets for their respective overnight rates. The European Central Bank and the Bank of Japan have kept their policy rates at 4 percent and 0.5 percent respectively. (Further discussion of actions by foreign central banks is in the box entitled "The Federal Reserve's Responses to Financial Strains.")
Emerging-Market Economies
The growth of output in the emerging-market economies also slowed in the second half of 2007 but was still strong. In China, government policy measures helped moderate the growth rate of real GDP in the second half. To damp loan growth, the government in 2007 repeatedly raised the reserve requirement ratio and the benchmark rate at which banks can lend to their customers. In addition, the government directed banks to freeze their level of lending over the final two months of 2007 at the October level. Chinese authorities also allowed the renminbi's rate of appreciation to step up in late 2007, and the People's Bank of China noted in its monetary policy report in November that it would be using the exchange rate as a tool to fight inflation.
Elsewhere in emerging Asia, growth appears to have stepped down to a more tempered pace in several countries in the second half of the year, though generally from very strong levels in the first half. One factor suppressing growth in these export-dependent economies appears to be a softening of the rate of activity in the rest of the world.
In Mexico, output growth was moderate in 2007 and followed roughly the same pattern as in the United States. The growth of economic activity exceeded 5 percent during the third quarter but slowed to 3 percent in the fourth quarter. In Brazil and other Latin American countries, growth was robust.
Increases in the prices of food and fuel contributed to a rise in consumer price inflation in many emerging-market economies. Prices of edible oils and grains were boosted by increased demand, higher energy prices, and unfavorable weather in several producing regions. Meat and dairy prices have also increased as consumption of these products in developing countries has grown rapidly and as the price of animal feed--mostly grain--has risen. Inflation rose during 2007 in many emerging Asian economies, including China, where the inflation rate for the twelve months ending in January reached just over 7 percent. Also, the pace of consumer price inflation rose in the second half of the year in Argentina, Chile, Mexico, and Venezuela. The rise in inflation in Venezuela was compounded by stimulative monetary and fiscal policies.
1. Nonprime mortgages comprise subprime and near-prime loans and accounted for about one-fourth of all home-purchase mortgages in 2006. Near-prime mortgages are generally less risky than subprime mortgages but riskier than prime mortgages; they may require limited or no borrower documentation, have nontraditional amortization structures or high loan-to-value ratios, or be made on investment properties.
2. The index is the seasonally adjusted purchase-only version of the repeat-transactions price index for existing single-family homes published by the Office of Federal Housing Enterprise Oversight.
3. Conforming mortgages are those eligible for purchase by Fannie Mae and Freddie Mac; they must be equivalent in risk to a prime mortgage with an 80 percent loan-to-value ratio, and they cannot exceed the conforming loan limit. The Economic Stimulus Act of 2008, signed into law on February 13, retroactively raised the conforming loan limit for a first mortgage on a single-family home in the contiguous United States from $417,000 to 125 percent of the median house price in an area, with an overall cap of $729,750. The new conforming limit will be in effect through the end of 2008.
4. Jumbo mortgages are those that exceed the maximum size of a conforming loan; they are typically extended to borrowers with relatively strong credit histories.
5. The initial low-rate period for most subprime ARMs originated in the period from 2005 to 2007 was twenty-four months. Roughly 1-1/2 million subprime ARMs are scheduled to undergo their first rate reset in 2008. Even with the recent declines in market interest rates, a notable fraction of those subprime ARMs are scheduled to reset to a higher interest rate.
6. The Hope Now Alliance (www.hopenow.com) aims to increase outreach efforts to contact at-risk borrowers and to play an important role in streamlining the process for refinancing and modifying subprime ARMs. The alliance will work to expand the capacity of an existing national network to counsel borrowers and refer them to participating servicers, who have agreed to work toward cross-industry solutions to better serve the homeowner.
7. The plunge in business outlays on motor vehicles in the first half was related to new Environmental Protection Agency emissions standards for large trucks, which went into effect at the start of 2007. Many firms had accelerated their purchases of such trucks into 2005 and 2006 so that they could take delivery before the new standards went into effect and thus avoid the higher costs associated with those standards. Outlays on motor vehicles rose modestly, on net, in the second half of the year.
8. The difference between economic profits and S&P operating earnings in the third quarter is attributable primarily to numerous asset write-downs and capital losses, which are generally excluded in the calculation of economic profits but are included as an expense in operating earnings per share of financial firms.
9. Income received from the exercise of stock options is included in the measure of hourly compensation in the nonfarm business sector but not in the ECI. Income received from most types of bonuses is included in both measures of compensation.
10. The effect of energy prices on GDP prices was much smaller than that on PCE prices. The reason is that much of the energy-price increase was attributable to the higher price of imported oil, which is excluded from GDP because it is not part of domestic production.
11. In December, a group of investor representatives agreed in principle to restructure Canadian nonbank ABCP into longer-term notes.
12. The data for commercial bank balance sheets are adjusted for some shifts of assets and liabilities between commercial banks and nonbanks, including those resulting from mergers, acquisitions, changes in charter, and asset purchases and sales.
Monetary Policy
Throughout the first half of 2007, the available information pointed to a generally favorable economic outlook despite the ongoing correction in the housing market. Indicators of consumer and business spending were somewhat uneven, but their generally positive trajectories suggested that the housing market developments were, as yet, having little effect on the broader economy. Net exports, spurred in part by a falling dollar, were providing support to economic growth. Outside of the subprime mortgage sector, financial conditions in general were fairly accommodative. The Federal Open Market Committee expected core inflation to moderate from the somewhat elevated level that had prevailed at the start of the year, but high resource utilization had the potential to sustain upward pressure on inflation. As a result, during the first half of the year, the Committee consistently noted in its statement that its predominant policy concern was that inflation would fail to moderate as expected. However, in part owing to indications of increasing weakness in the housing sector, the Committee emphasized in the statements issued at the conclusion of its March, May, and June meetings that its future policy actions would depend on the evolution of the outlook for both inflation and economic growth.
Selected Interest Rates, 2005-08, Target Federal Funds Rate
The data are daily and extend through February 21, 2008. The dates on the horizontal axis are those of regularly scheduled FOMC meetings.
Source: Federal Reserve.
When the Committee met on August 7, financial markets had been unusually volatile for a few weeks, and credit conditions had become somewhat tighter for some households and businesses. Participants in FOMC meetings (Board members and Reserve Bank presidents) noted that adjustments in the housing sector had the potential to prove deeper and more prolonged than had seemed likely earlier in the year, and a further underperformance in the housing area represented a significant downside risk to the economic outlook. Nonetheless, incoming data indicated that economic growth had strengthened in the second quarter, as a quicker pace of business spending offset a slowdown in consumer outlays. Participants believed that the economy remained likely to expand at a moderate pace in coming quarters, supported in part by continued growth in business investment and a robust global economy. Although core inflation had moved lower since the start of the year, participants were still concerned about several factors--including a continued high level of resource utilization--that could augment inflation pressures. They believed that a sustained moderation in those pressures had yet to be convincingly demonstrated. As a result, the FOMC decided to leave the target for the federal funds rate unchanged at 5-1/4 percent and, despite somewhat greater downside risks to growth, reiterated that the predominant policy concern remained the risk that inflation would fail to moderate as expected.
In the days following the August 7 FOMC meeting, financial conditions deteriorated rapidly as market participants became concerned about counterparty credit risk and their access to liquidity. After an FOMC conference call on August 10 to review worsening strains in money and credit markets, the Committee issued a statement indicating that the Federal Reserve would provide reserves as necessary through open market operations to promote trading in the federal funds market at rates close to the FOMC's target rate of 5-1/4 percent. As conditions deteriorated further, the Committee met again on August 16 by conference call to discuss the potential usefulness of various policy responses. The following day, the Federal Reserve announced changes in discount window policies to facilitate the orderly functioning of short-term credit markets. Furthermore, the FOMC released a statement indicating that the downside risks to growth had increased appreciably and that the Committee was prepared to act as needed to mitigate adverse effects on the economy. (The box entitled "The Federal Reserve's Responses to Financial Strains" provides additional detail on the outcomes of these conference calls and other measures taken by the Federal Reserve to facilitate the orderly functioning of financial markets over the second half of the year, including coordinated actions with other central banks.)
At the time of the September FOMC meeting, financial markets remained volatile. Liquidity in short-term funding markets was significantly impaired amid heightened investor unease about exposures to subprime mortgages and to structured credit products more broadly. Credit generally remained available for most businesses and households, but the Committee noted that the tighter credit conditions for other borrowers had the potential to restrain economic growth. Incoming economic data were mixed: Consumer spending appeared to have strengthened from its subdued second-quarter pace, but a further intensification of the housing contraction and slowing employment growth suggested a weaker economic outlook. Participants noted that incoming data on core inflation continued to be favorable and that the downwardly revised economic outlook implied some lessening of pressures on resources, but they remained concerned about possible upside risks to inflation. To forestall some of the adverse macroeconomic effects that might otherwise arise from the disruptions in financial markets and to promote moderate growth over time, the FOMC lowered the target for the federal funds rate 50 basis points, to 4-3/4 percent. The Committee also noted that recent developments had increased the uncertainty surrounding the economic outlook and stated that it would act as needed to foster price stability and sustainable economic growth.
At the time of the October FOMC meeting, the data indicated that economic growth had been solid in the third quarter. A pickup in consumer spending and continued expansion of business investment suggested that spillovers from the turmoil in the housing and financial markets had been limited to that point. Although strains in financial markets had eased somewhat on balance, tighter credit conditions were thought likely to slow the pace of economic expansion over coming quarters. Furthermore, the downturn in residential construction had deepened, and available indicators pointed to a further slowing in housing activity in the near term. FOMC meeting participants noted that readings on core inflation had improved somewhat over the year and anticipated that some of the moderation likely would be sustained. Nonetheless, participants expressed concern about the upside risks to the outlook for inflation, stemming in part from the effects of recent increases in commodity prices and the significant decline in the foreign exchange value of the dollar. Against that backdrop, the Committee decided to lower the target for the federal funds rate 25 basis points, to 4-1/2 percent, and judged that the upside risks to inflation roughly balanced the downside risks to growth.
Also at the October meeting, the Committee continued its discussions regarding communication with the public. Participants reached a consensus on increasing the frequency and expanding the content of their periodic economic projections. Under the new procedure, which was announced on November 14, the FOMC compiles and releases the projections made by the Federal Reserve Governors and Reserve Bank presidents four times each year, at approximately quarterly intervals, rather than twice each year, as had been the practice since 1979. In addition, the projection horizon has been extended from two years to three years. FOMC meeting participants provide projections for the increase in the price index for total personal consumption expenditures (PCE) as well as projections for real GDP growth, the unemployment rate, and core PCE price inflation. Summaries of the projections and an accompanying narrative are published along with the minutes of the FOMC meeting at which they were discussed. Beginning with the present report, the projections made in January are included in the February Monetary Policy Report to the Congress, and the projections made in June are included in the July report.
In a conference call on December 6, Board members and Reserve Bank presidents reviewed conditions in domestic and foreign financial markets and discussed two proposals aimed at improving market functioning. The first proposal was for the establishment of a temporary Term Auction Facility (TAF), which would provide term funding through an auction mechanism to eligible depository institutions against a broader range of collateral than that used for open market operations. The second proposal was to set up a foreign exchange swap arrangement with the European Central Bank to address elevated pressures in short-term dollar funding markets. At the conclusion of the discussion, the Committee voted to direct the Federal Reserve Bank of New York to establish and maintain a reciprocal currency (swap) arrangement for the System Open Market Account with the European Central Bank.13 The Board of Governors approved the TAF via notation vote on December 10.
At the Committee's meeting on December 11, participants noted that incoming information suggested economic activity had decelerated significantly in the fourth quarter. The housing contraction had steepened further, and participants agreed that the sector was weaker than had been expected at the time of the Committee's previous meeting. Moreover, spillovers from housing to other parts of the economy had begun to emerge: Consumption spending appeared to be softening more than had been anticipated, and employment gains appeared to be slowing. Participants noted that evidence of further deterioration in the credit quality of mortgages and other loans to households appeared to be spurring lenders to further tighten the terms on new extensions of credit for a widening range of credit products. Financial market conditions had worsened significantly. The financial strains were exacerbated by concerns related to year-end pressures in short-term funding markets, and similar stresses were evident in the financial markets of major foreign economies. Although a surge in energy prices pushed up headline consumer price inflation during September and October, Committee members agreed that the inflation situation had changed little from the time of the previous meeting. In these circumstances, the FOMC lowered the target for the federal funds rate a further 25 basis points, to 4-1/4 percent, and, given the heightened uncertainty, the Committee decided to refrain from providing an explicit assessment of the balance of risks. The Committee also indicated that it would continue to assess the effects of financial and other developments on economic prospects and act as needed to foster price stability and sustainable economic growth. In addition to that policy move, the Federal Reserve and several other central banks announced on December 12 the measures they were taking to address elevated pressures in short-term funding markets. The Federal Reserve announced the creation of the TAF and the establishment of foreign exchange swap lines with the European Central Bank and the Swiss National Bank.
In a conference call on January 9, the Committee reviewed recent economic data and financial market developments. The information, which included weaker-than-expected data on home sales and employment for December, as well as a sharp decline in equity prices since the beginning of the year, suggested that the downside risks to growth had increased significantly since the time of the December FOMC meeting. Moreover, participants cited concerns that the slowing of economic growth could lead to a further tightening of financial conditions, which in turn could reinforce the economic slowdown. However, participants noted that core inflation had edged up in recent months and believed that considerable uncertainty surrounded the inflation outlook. Participants were generally of the view that substantial additional policy easing might well be necessary to support economic activity and reduce the downside risks to growth, and they discussed the possible timing of such actions.
On January 21, the Committee held another conference call. Participants in the call noted that strains in some financial markets had intensified and that incoming evidence had reinforced their view that the outlook for economic activity was weak. Participants observed that investors apparently were becoming increasingly concerned about the economic outlook and that these developments could lead to an excessive pullback in credit availability. Against that background, members judged that a substantial easing in policy was appropriate to foster moderate economic growth and reduce the downside risks to economic activity. The Committee decided to lower the target for the federal funds rate 75 basis points, to 3-1/2 percent, and stated that appreciable downside risks to growth remained. Although inflation was expected to edge lower over the course of 2008, participants underscored that this assessment was conditioned upon inflation expectations remaining well anchored and stressed that the inflation situation should continue to be monitored carefully.
The data reviewed at the regularly scheduled FOMC meeting on January 29 and 30 confirmed a sharp deceleration in economic growth during the fourth quarter of 2007 and continued tightening of financial conditions. With the contraction in the housing sector intensifying and a range of financial markets remaining under pressure, participants generally expected economic growth to remain weak in the first half of 2008 before picking up strength in the second half. However, the continuing weakness in home sales and house prices, as well as the tightening of credit conditions for households and businesses, were seen as posing downside risks to the near-term outlook for economic growth. Moreover, many participants cited risks regarding the potential for adverse feedback between the financial markets and the economy. Participants expressed some concern about the disappointing inflation data received over the latter part of 2007. Although many expected that a leveling out of prices for energy and other commodities, such as that embedded in futures markets, and a period of below-trend growth would contribute to some moderation in inflation pressures over time, the Committee believed that it remained necessary to monitor inflation developments carefully. Against that backdrop, the FOMC decided to lower the target for the federal funds rate 50 basis points, to 3 percent. The Committee believed that the policy action, combined with those taken earlier, would help promote moderate growth over time and mitigate the risks to economic activity. However, members judged that downside risks to growth remained.
Footnotes
13. A swap arrangement with the Swiss National Bank was approved by the Committee on December 11.
Summary of Economic Projections
In conjunction with the January 2008 FOMC meeting, the members of the Board of Governors and the presidents of the Federal Reserve Banks, all of whom participate in the deliberations of the FOMC, provided projections for economic growth, unemployment, and inflation in 2008, 2009, and 2010. Projections were based on information available through the conclusion of the January meeting, on each participant's assumptions regarding a range of factors likely to affect economic outcomes, and on his or her assessment of appropriate monetary policy. "Appropriate monetary policy" is defined as the future policy that, based on current information, is deemed most likely to foster outcomes for economic activity and inflation that best satisfy the participant's interpretation of the Federal Reserve's dual objectives of maximum employment and price stability.
The projections, which are summarized in table 1 and chart 1, suggest that FOMC participants expected that output would grow at a pace appreciably below its trend rate in 2008, owing primarily to a deepening of the housing contraction and a tightening in the availability of household and business credit, and that the unemployment rate would increase somewhat. Given the substantial reductions in the target federal funds rate through the January FOMC meeting as well as the assumption of appropriate policy going forward, output growth further ahead was projected to pick up to a pace around or a bit above its long-run trend by 2010. Inflation was expected to decline in 2008 and 2009 from its recent elevated levels as energy prices leveled out and economic slack contained cost and price increases. Most participants judged that considerable uncertainty surrounded their projections for output growth and viewed the risks to their forecasts as weighted to the downside. A majority of participants viewed the risks to the inflation outlook as broadly balanced, but a number of participants saw the risks to inflation as skewed to the upside.
Note: Table corrected to match printable version (15.23 MB PDF) of report.
Note: Projections of the growth of real GDP, of PCE inflation, and of core PCE inflation are percent changes from the fourth quarter of the previous year to the fourth quarter of the year indicated. PCE inflation and core PCE inflation are the percentage rates of change in, respectively, the price index for personal consumption expenditures and the price index for personal consumption expenditures excluding food and energy. Projections for the unemployment rate are for the average civilian unemployment rate in the fourth quarter of the year indicated. Each participant's projections are based on his or her assessment of appropriate monetary policy.
1. The central tendency excludes the three highest and three lowest projections for each variable in each year. Return to table
2. The range for a variable in a given year includes all participants' projections, from lowest to highest, for that variable in that year. Return to table
Chart 1: Central Tendencies and Ranges of Economic Projections*
The Outlook
With output growth running below trend over the next year or so, most participants expected that the unemployment rate would edge higher. The central tendency of participants' projections for the average rate of unemployment in the fourth quarter of 2008 was 5.2 to 5.3 percent, above the 4.8 to 4.9 percent unemployment rate forecasted in October and broadly suggestive of some slack in labor markets. The unemployment rate was generally expected to change relatively little in 2009 and then to edge lower in 2010 as output growth picks up, although in both years the unemployment rate was projected to be a little higher than had been anticipated in October.
The higher-than-expected rates of overall and core inflation since October, which were driven in part by the steep run-up in oil prices, had caused participants to revise up somewhat their projections for inflation in the near term. The central tendency of participants' projections for core PCE inflation in 2008 was 2.0 to 2.2 percent, up from the 1.7 to 1.9 percent central tendency in October. However, core inflation was expected to moderate over the next two years, reflecting muted pressures on resources and fairly well-anchored inflation expectations. Overall PCE inflation was projected to decline from its current elevated rate over the coming year, largely reflecting the assumption that energy and food prices would flatten out. Thereafter, overall PCE inflation was projected to move largely in step with core PCE inflation.
Participants' projections for 2010 were importantly influenced by their judgments about the measured rates of inflation consistent with the Federal Reserve's dual mandate to promote maximum employment and price stability and about the time frame over which policy should aim to attain those rates given current economic conditions. Many participants judged that, given the recent adverse shocks to both aggregate demand and inflation, policy would be able to foster only a gradual return of key macroeconomic variables to their longer-run sustainable or optimal levels. Consequently, the rate of unemployment was projected by some participants to remain slightly above its longer-run sustainable level even in 2010, and inflation was judged likely still to be a bit above levels that some participants judged would be consistent with the Federal Reserve's dual mandate.
Risks to the Outlook
Regarding risks to the inflation outlook, several participants pointed to the possibility that real activity could rebound less vigorously than projected, leading to more downward pressure on costs and prices than anticipated. However, participants also saw a number of upside risks to inflation. In particular, the pass-through of recent increases in energy and commodity prices as well as of past dollar depreciation to consumer prices could be greater than expected. In addition, participants recognized a risk that inflation expectations could become less firmly anchored if the current elevated rates of inflation persisted for longer than anticipated or if the recent substantial easing in monetary policy was misinterpreted as reflecting less resolve among Committee members to maintain low and stable inflation. On balance, a larger number of participants than in October viewed the risks to their inflation forecasts as broadly balanced, although several participants continued to indicate that their inflation projections were skewed to the upside.
The ongoing financial market turbulence and tightening of credit conditions had increased participants' uncertainty about the outlook for economic activity. Most participants judged that the uncertainty attending their January projections for real GDP growth and for the unemployment rate was above typical levels seen in the past. (Table 2 provides an estimate of average ranges of forecast uncertainty for GDP growth, unemployment, and inflation over the past twenty years.14)In contrast, the uncertainty attached to participants' inflation projections was generally viewed as being broadly in line with past experience, although several participants judged that the degree of uncertainty about inflation was higher than normal.
Note: Error ranges shown are measured as plus or minus the root mean squared error of projections that were released in the winter from 1986 through 2006 for the current and following two years by various private and government forecasters. As described in the box "Forecast Uncertainty," under certain assumptions, there is about a 70 percent probability that actual outcomes for real GDP, unemployment, and consumer prices will be in ranges implied by the average size of projection errors made in the past. Further information is in David Reifschneider and Peter Tulip (2007), "Gauging the Uncertainty of the Economic Outlook from Historical Forecasting Errors," Finance and Economics Discussion Series #2007-60 (November).
1. Projection is percent change, fourth quarter of the previous year to fourth quarter of the year indicated. Return to table
2. Projection is the fourth quarter average of the civilian unemployment rate (percent). Return to table
3. Measure is the overall consumer price index, the price measure that has been most widely used in government and private economic forecasts. Projection is percent change, fourth quarter of the previous year to the fourth quarter of the year indicated. The slightly narrower estimated width of the confidence interval for inflation in the third year compared with those for the second and first years is likely the result of using a limited sample period for computing these statistics. Return to table
Diversity of Participants' Views
Chart 2(a): Distribution of Participants' Projections (percent)*
Chart 2(b): Distribution of Participants' Projections (percent)*
Forecast Uncertainty
The economic projections provided by the members of the Board of Governors and the presidents of the Federal Reserve Banks help shape monetary policy and can aid public understanding of the basis for policy actions. Considerable uncertainty attends these projections, however. The economic and statistical models and relationships used to help produce economic forecasts are necessarily imperfect descriptions of the real world. And the future path of the economy can be affected by myriad unforeseen developments and events. Thus, in setting the stance of monetary policy, participants consider not only what appears to be the most likely economic outcome as embodied in their projections, but also the range of alternative possibilities, the likelihood of their occurring, and the potential costs to the economy should they occur.
Table 2 summarizes the average historical accuracy of a range of forecasts, including those reported in past Monetary Policy Reports and those prepared by Federal Reserve Board staff in advance of meetings of the Federal Open Market Committee. The projection error ranges shown in the table illustrate the considerable uncertainty associated with economic forecasts. For example, suppose a participant projects that real GDP and total consumer prices will rise steadily at annual rates of, respectively, 3 percent and 2 percent. If the uncertainty attending those projections is similar to that experienced in the past and the risks around the projections are broadly balanced, the numbers reported in table 2 might imply a probability of about 70 percent that actual GDP would expand between 1.8 percent to 4.2 percent in the current year, and 1.6 percent to 4.4 percent in the second and third years. The corresponding 70 percent confidence intervals for overall inflation would be 1 percent to 3 percent in the current and second years, and 1.1 percent to 2.9 percent in the third year.
Because current conditions may differ from those that prevailed on average over history, participants provide judgments as to whether the uncertainty attached to their projections of each variable is greater than, smaller than, or broadly similar to typical levels of forecast uncertainty in the past as shown in table 2. Participants also provide judgments as to whether the risks to their projections are weighted to the upside, downside, or are broadly balanced. That is, participants judge whether each variable is more likely to be above or below their projections of the most likely outcome. These judgments about the uncertainty and the risks attending each participant's projections are distinct from the diversity of participants' views about the most likely outcomes. Forecast uncertainty is concerned with the risks associated with a particular projection, rather than with divergences across a number of different projections.
Footnotes
14. The box "Forecast Uncertainty" at the end of this summary discusses the sources and interpretation of uncertainty in economic forecasts and explains the approach used to assess the uncertainty and risks attending participants' projections.